
Reframing AI ROI: How CFOs Can Justify Tech Investments
April 17, 2026 / Bryan Reynolds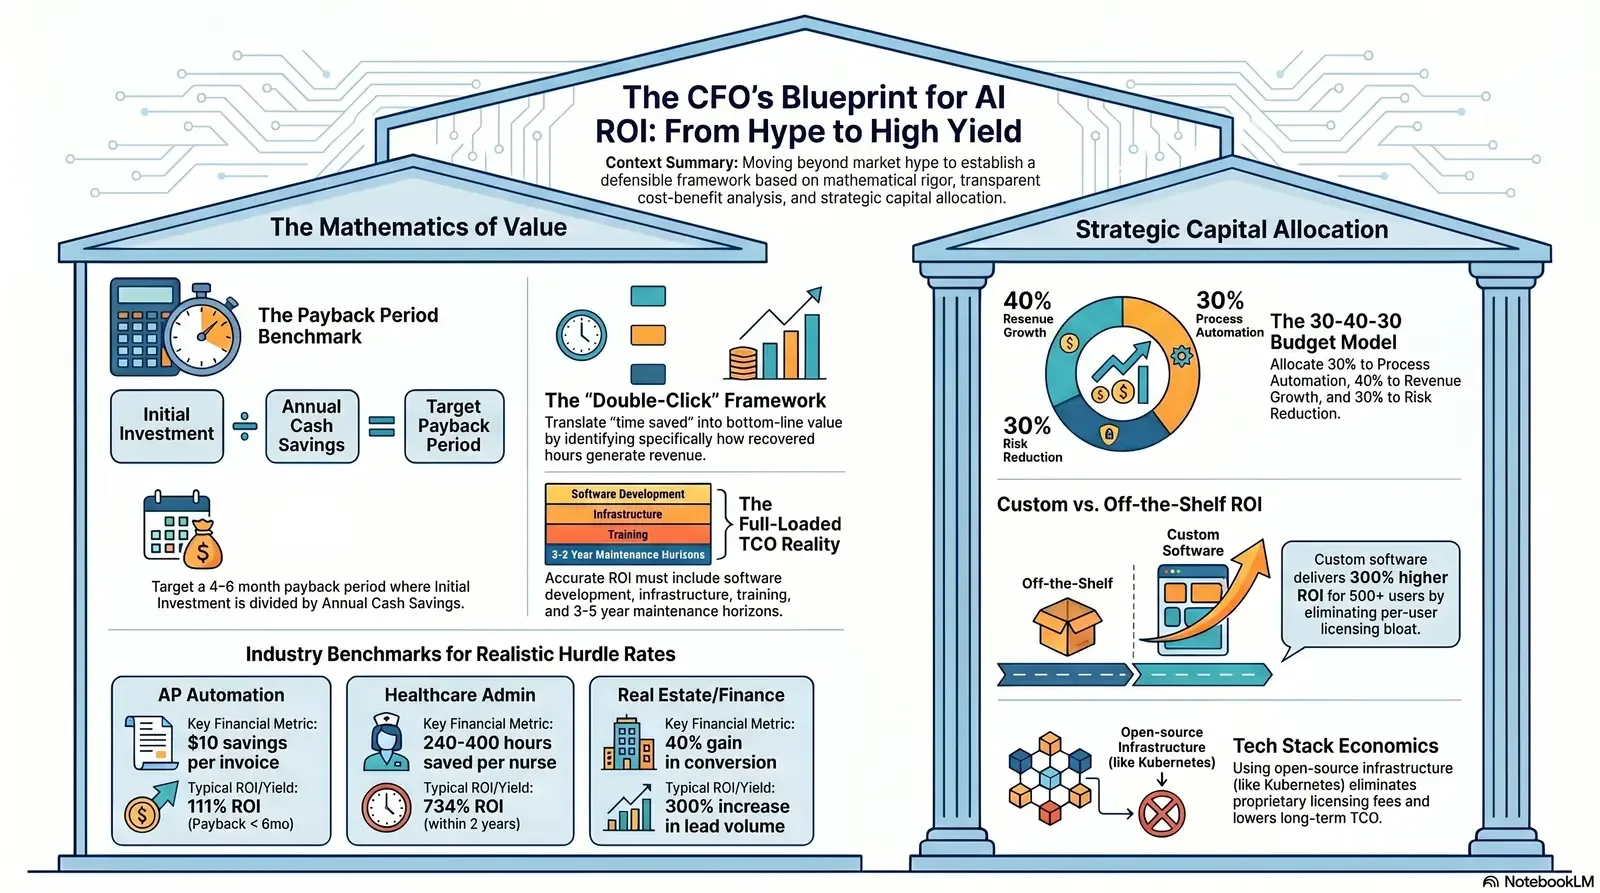
The CFO's Guide to AI ROI: The Financial Justification for Custom Automation
"How do I prove the value of an AI project?" This singular question currently echoes through the boardrooms of global business-to-business (B2B) enterprises, marking a critical transition in the corporate technology landscape. Financial leadership is navigating a period of unprecedented technological pressure, driven by relentless market hype and the urgent demand from executive boards to integrate artificial intelligence (AI) and advanced automation into legacy workflows. However, the mandate from the chief financial officer (CFO) and the finance department remains rooted in empirical reality and fiduciary responsibility: capital investments must generate a verifiable, sustainable return. The conversation must inevitably pivot from the allure of "cool technology" to the mathematical rigor of hours saved multiplied by hourly rates, establishing a concrete, defensible framework for capital allocation.
While artificial intelligence promises transformative efficiency, the reality of enterprise adoption presents a stark contrast to vendor marketing materials. Recent empirical studies and market analyses reveal that 95% of enterprise AI initiatives fail to meet their intended business objectives. For the finance department, this sobering statistic transforms AI from an automated panacea into a high-risk capital expenditure. As organizations transition from experimental pilot programs to scaled enterprise execution, achieving a solid, verifiable return on investment (ROI) becomes the definitive metric of success.
Despite widespread enthusiasm across industries, a comprehensive survey of finance executives revealed that the median reported ROI for generative AI implementation is currently sitting at just 10%. This yield is significantly below the 20% internal hurdle rate that most organizations require to justify the underlying operational risk and capital expense of deployment. This disconnect stems not from a lack of engineering effort or technical capability, but from a fundamental failure to prioritize value realization over technological experimentation.
This comprehensive research report details exactly how financial leaders can quantify the value of custom automation, calculate accurate payback periods, measure human efficiency gains, and build an airtight business case for technological investment. By establishing rigorous efficiency metrics and relying on transparent cost-benefit analyses, organizations can successfully traverse the gap between technological potential and financial reality, transforming automation from a speculative experiment into a core driver of corporate profitability.
Decoding the ROI and Payback Formulas
To accurately capture the ROI of artificial intelligence and workflow automation, the traditional financial formula—(Net Benefit / Total Investment) × 100—must be heavily contextualized for the digital age. In the realm of automation, "benefits" encompass significantly more than just direct, line-item cost savings; they include productivity gains, profound error reduction, opportunity costs, and the strategic reallocation of human capital to higher-yield activities. This is especially true as enterprises mature into broader AI readiness and scaling programs that touch multiple business units.
While Return on Investment evaluates the total financial value generated over the life of a software asset, the Payback Period is the definitive metric for assessing immediate financial risk and liquidity impact. The payback period dictates exactly how long it will take for an automation investment to break even and "pay for itself" through measurable efficiency gains.
The fundamental formula is straightforward: Payback Period = Initial Investment / Annual Cash Savings.
If a corporation invests $100,000 in a custom-built automation application, and that application yields $250,000 in annual savings through reduced labor, accelerated processing, and the elimination of error-related penalties, the mathematics are precise: $100,000 divided by $250,000 equals 0.4 years. This equates to a payback period of approximately 4.8 months. After the fifth month, the system operates in a state of pure financial gain, padding the bottom line. For mid-market firms and enterprise environments, strategic financial guidelines suggest targeting a payback period of four to six months, with the ultimate objective of achieving an ROI exceeding 300% by the 12-month mark.
When calculating these metrics, precision in assessing the "Initial Investment" is absolutely critical. The calculation must encompass the Total Cost of Ownership (TCO). This includes the direct cost of software development, server infrastructure, implementation labor, staff training, and the ongoing maintenance and licensing required to keep the ecosystem operational over a three-to-five-year horizon.
To ensure comprehensive financial validation, CFOs are increasingly employing advanced capital budgeting techniques beyond basic payback analysis. Net Present Value (NPV) and Internal Rate of Return (IRR) calculations provide a more sophisticated view of an automation project's true worth, particularly for investments exceeding $100,000. For software-as-a-service (SaaS) and technology providers, these efficiency gains must also be translated into customer-centric metrics, such as the Customer Acquisition Cost (CAC) Payback Period, which calculates the months required to recover upfront sales and marketing costs through gross margin dollars generated by a newly automated client onboarding workflow. For SaaS firms building embedded AI into their products, this aligns closely with how modern AI copilots reshape product economics.
Advanced Frameworks for Measuring Automation Efficiency
Organizations that successfully achieve returns exceeding 300% on their automation investments exhibit fundamentally different behaviors than the market average. They focus on value from the very beginning, actively collaborate with specialized technical vendors rather than attempting to build all infrastructure internally, and deploy solutions in a sequenced, agile manner. Most importantly, they replace vague promises of "improved efficiency" with stringent, multi-layered financial frameworks. Financial leaders and operations directors have pioneered several distinct frameworks to capture this nuanced value accurately.
The OKR Integration Framework
Standalone metrics for artificial intelligence often devolve into vanity metrics. The OKR (Objectives and Key Results) Integration Framework dictates that teams should never create separate, isolated performance indicators for technological tools. Instead, automation investments must be tied directly and exclusively to accelerating existing corporate goals and timelines. If the enterprise goal is to reduce customer acquisition cost by 15% or accelerate monthly financial close cycles by three days, the automation's value is measured solely by its contribution to that specific operational reduction, rather than the raw number of times a machine learning algorithm is executed. This is also where robust developer productivity and outcome metrics become essential, so you can connect engineering output to business goals.
The Telemetry Framework
Granular visibility is required to prevent cost overruns and identify "zombie" software subscriptions. The Telemetry Framework requires that all technological spending be segmented by team, user, specific business problem, and activity type. This allows the finance department to identify precisely which departments are actually generating ROI from the deployed tools and which are merely accumulating operational expenses without commensurate output.
The Double-Click Framework
Perhaps the most critical framework for the modern CFO is the Double-Click Framework. When a department head claims an automation project has "saved time," the financial officer must continually ask "so what?" until a measurable business outcome is reached. That simple question forces the conversation from vague efficiency to specific, dollar-based impact.
If an automated quoting engine saves an operations manager 20 minutes per quote, the initial metric is simply time. The first "double-click" reveals that the manager processes 1,500 quotes annually, saving 500 hours over a twelve-month period. The final "double-click" reveals exactly what is done with those 500 recovered hours. If the manager is compensated at $60 per hour, the direct savings equate to $30,000. Furthermore, if those 500 hours are reallocated to strategic client outreach that generates 20 additional closed deals, the value compounds significantly into top-line revenue growth.

The Team Output Framework
This macro-level framework involves plotting aggregate team output against overall team size over a chronological period. If a logistics company implements document extraction automation and processes 40% more invoices over three years while maintaining a perfectly flat headcount, the value of the automation is realized in cost avoidance—specifically, the salaries, benefits, and overhead of the additional personnel that would have been required to handle the increased volume.
The Unified Budget Framework
A highly progressive approach to capital allocation involves combining software expenditures and human headcount into a single, unified budget envelope tied to specific business outcomes. This paradigm shift forces department leaders to weigh the financial merits of hiring an additional operations analyst versus investing in a custom software application to achieve the exact same operational objective, ensuring that technology is viewed as a direct alternative to labor costs.
| Evaluation Framework | Primary Objective | Key Financial Metric | Optimal Use Case |
|---|---|---|---|
| OKR Integration | Align tech with corporate goals | Goal acceleration rate | Enterprise-wide strategic transformations |
| Telemetry | Granular cost visibility | Cost per user/activity | Evaluating broad SaaS subscriptions |
| Double-Click | Convert time to financial value | Top-line revenue impact | Task-specific automation tools |
| Team Output | Measure aggregate efficiency | Cost avoidance (headcount) | High-volume processing departments |
| Unified Budget | Optimize resource allocation | TCO vs. Fully Loaded Labor | Departmental annual budgeting |
The Mathematics of "Hours Saved"
Quantifying the precise value of a returned hour is the bedrock of automation cost-benefit analysis. A common, catastrophic error in ROI calculations is treating "hours saved" as a homogenous, flat metric. In reality, the value of an automated process depends entirely on the compensation tier of the employee performing the task, the frequency of the task, and the alternative value of the employee's time.
To build a definitive business case, financial analysts must execute the following equation with absolute precision:
First, analysts must calculate current state execution by identifying the exact amount of time spent per task (for instance, 20 minutes per manual data entry) and multiply that by the annual volume of the task (such as 1,500 entries per year). Second, they must determine the hourly compensation by identifying the total hourly cost of the employee, including benefits and overhead. For example, market data indicates the average annual pay for a B2B Operations Analyst Manager is approximately 70,210, equating to roughly 33.75 per hour, though top earners in major metropolitan areas can scale significantly higher.
Third, the analyst must apply the automation yield. If the proposed custom software eliminates 100% of the manual process, the calculation yields the total hours saved. However, if the process is highly variable—where some tasks take 5 minutes and others require substantial rework taking over an hour—using conservative weighted averages is necessary to avoid overpromising benefits to stakeholders. Finally, the total hours saved are multiplied by the fully loaded employee cost per hour to derive the final direct financial value.
Case Study: Accounts Payable (AP) Automation Economics
Consider the daily mechanics of the Accounts Payable department. Manual processes bog down financial teams with tedious data entry, slow approval cycles, limited visibility into spending, and frequent errors. Industry estimates from procurement analysts indicate that processing a single invoice manually costs an average of $12.88, factoring in labor, routing, and exception handling. Furthermore, issuing manual checks costs over $9 for every payment made.
When a Fortune 500 retailer replaced a completely manual invoice process—which previously required staff to hand-key 750,000 invoices annually into their Enterprise Resource Planning (ERP) system—with automated AP software, the results fundamentally altered their cost structure. Best-in-class automated organizations can reduce the cost of invoice processing to just $2.78 per unit, saving roughly $10 per invoice. In a volume scenario of 750,000 invoices, this 10 per-invoice savings translates to 7.5 million in pure direct cost reduction, entirely independent of the strategic value gained by reallocating the AP staff's recovered time. Furthermore, rapid automated processing allows the finance department to capture early payment discounts from vendors, unlocking additional working capital while improving supplier relationships. Models based on the Total Economic Impact (TEI) framework show that implementing modern accounts payable automation can achieve an ROI of 111% with payback in under 6 months.
The Build vs. Buy Dilemma: Custom Software vs. Off-the-Shelf
When evaluating the cost-benefit analysis of an automation rollout, financial decision-makers face a critical architectural divergence: should the organization purchase commercial off-the-shelf (COTS) software, or invest in custom software development engineered specifically for their workflows?
The traditional adage of "buy when you can, build when you must" is an oversimplification that frequently leads to financial inefficiency and operational rigidity in the modern era. Off-the-shelf platforms—such as standard CRM systems, generic task automation bots, or pre-packaged workflow tools—offer low upfront capital costs, rapid deployment timelines, and the allure of immediate functionality. For early-stage startups or small enterprises with highly standardized, simple processes, this route often provides an acceptable, albeit limited, short-term ROI. For larger, more complex organizations, however, layering AI onto those tools often requires additional patterns like AI sidecars that minimize risk and maximize ROI without a rip-and-replace.
However, the Total Cost of Ownership (TCO) equation heavily favors custom software as organizational complexity increases. Many companies that initially select off-the-shelf solutions eventually spend two to three times more on forced customizations, complex API integrations, and manual workarounds to accommodate workflows the generic software was never designed to handle. Furthermore, off-the-shelf models rely on recurring, per-user subscription fees. As an organization scales and adds personnel, these licensing costs bloat exponentially, severely eroding long-term profit margins.
Custom software represents a higher initial capital expenditure and a longer runway to deployment. Yet, the financial justification is remarkably robust: custom solutions offer a 300% higher ROI for companies exceeding 500 users. Because the software is purpose-built from the ground up to map exactly to the company’s unique business logic and operational quirks, it eliminates the need for expensive workarounds and shadow IT. It also provides a distinct competitive advantage; off-the-shelf software, by definition, is available to an organization's direct competitors, whereas a proprietary algorithm or custom automation engine is an exclusive corporate asset that cannot be easily replicated.
Forward-thinking enterprises frequently partner with custom software development specialists—such as Baytech Consulting—who leverage a Tailored Tech Advantage and Rapid Agile Deployment methodologies. These strategic partnerships excel because they utilize optimized technology stacks designed for total cost of ownership reduction. By delivering enterprise-grade quality on-time, highly skilled engineering teams mitigate the historical risks associated with custom builds—namely, cost overruns and delayed launches—ensuring the application moves quickly from the development phase into the cash-generating operational phase. Many executives also look beyond simple chatbots and toward AI automation that actually replaces busywork with robust workflows, further improving the payoff.
Tech Stack Economics: Engineering for Low TCO
The long-term ROI of custom automation is intrinsically linked to the underlying technical infrastructure used to host, deploy, and maintain it. Infrastructure decisions are not merely technical preferences; they directly dictate recurring operational expenses, scalability limits, and security postures.
Historically, managing on-premises or hybrid computing environments required expensive, proprietary hypervisors like VMware vSphere, which commanded steep recurring licensing fees and vendor lock-in. Today, modern architectural approaches drastically reduce these overheads, shifting the economic balance. The deployment of Harvester HCI—an open-source hyperconverged infrastructure solution built directly on Kubernetes—alongside management platforms like Rancher, provides an enterprise-ready platform that unifies virtual machines and container workloads without the crippling costs of proprietary software licenses. Harvester utilizes the Kubernetes API as a unified automation language, consolidating compute, storage, and networking into a streamlined, software-driven system.
This strategic shift to open-source, cloud-native infrastructure is a powerful financial lever in ROI optimization. When applications are containerized using Docker and orchestrated via Kubernetes on cost-effective, high-performance bare-metal environments like OVHCloud servers, compute costs become highly predictable and easily scalable. Furthermore, integrating robust relational database management systems like PostgreSQL (managed seamlessly via pgAdmin) or SQL Server ensures data integrity without unnecessary licensing bloat.
The speed of value delivery is equally critical to the financial equation. Utilizing advanced deployment pipelines and integrated development environments (IDEs) such as VS Code/VS 2022 and Azure DevOps On-Prem ensures that custom code is shipped efficiently, securely, and iteratively. Robust CI/CD (Continuous Integration/Continuous Deployment) pipelines have been empirically proven to increase feature throughput by roughly 40% while reducing production incidents by up to 80%. Azure network security and management tools like Azure Arc further extend centralized governance, yielding a reported 306% three-year return on investment, a 35% lower cost of operations, and an 85% reduction in unplanned downtime.
For a CFO calculating Total Cost of Ownership, this comprehensive infrastructure footprint—bolstered by reliable, open-source network security routing via pfSense and seamless internal collaboration via Microsoft 365, Teams, and OneDrive—creates an ecosystem where the custom application is inexpensive to run, highly secure, and incredibly resilient.
| Tech Stack Component | Operational Function | Direct Financial Impact |
|---|---|---|
| Harvester HCI & Rancher | Hyperconverged Infrastructure | Eliminates proprietary VMware licensing costs; lowers TCO |
| Kubernetes & Docker | Container Orchestration | Optimizes server resource utilization; prevents hardware bloat |
| Azure DevOps On-Prem | CI/CD Pipeline Management | 40% increase in feature throughput; 80% reduction in downtime |
| Postgres & SQL Server | Database Management | Highly scalable data storage with predictable cost structures |
| OVHCloud & pfSense | Hosting & Network Security | Cost-effective bare-metal performance with robust breach prevention |
Cross-Functional Alignment: The Executive Personas
The financial justification for automation cannot be formulated in a vacuum. To secure board approval, the business case must be universally understood across the C-suite, translating "ROI" into the specific operational languages of distinct executive personas.
The Strategic CFO The CFO views automation through the strict lens of risk mitigation, cash flow preservation, and working capital optimization. For this persona, the primary value driver is cost avoidance and balance sheet strength. Automation tools that provide real-time insights into payment terms and cash conversion cycles can lead to a 15% reduction in working capital, freeing up cash for aggressive growth initiatives. The Strategic CFO prioritizes Payback Period analysis and demands clear documentation of TCO to prevent hidden technological debt from eroding EBITDA margins. Furthermore, AI strengthens compliance (e.g., SOX, GDPR) and identifies suspicious transactions with far greater accuracy than manual reviews, significantly reducing fraud-related losses.
The Visionary CTO The Chief Technology Officer evaluates automation based on scalability, architectural integrity, and engineering deployment efficiency. For the CTO, utilizing tools like VS Code alongside robust Azure DevOps environments means software engineers spend their time building actual business value rather than fighting production fires or managing unwieldy legacy code. The Visionary CTO looks for hard metrics indicating reduced change failure rates (often dropping from 25% to single digits) and dramatically faster time-to-market for new strategic features. They are also responsible for protecting the organization from AI-driven technical debt and security risk, often by using patterns like an AI firewall to block prompt injection and data leakage.
The Innovative Marketing Director Artificial intelligence is fundamentally altering lead generation, content distribution, and market engagement. Industry statistics from 2024 show that 85% of B2B marketers recognize generative AI has permanently changed content creation paradigms. Furthermore, AI-driven marketing campaigns launch 75% faster and deliver 47% better click-through rates than traditional methods. For the Marketing Director, automation's value is proven through increased top-of-funnel lead volume, hyper-personalized audience segmentation, and a measurable reduction in customer acquisition costs (CAC).
The Driven Head of Sales Sales leadership demands pipeline velocity and higher close rates. Implementing AI to parse incoming leads and automate administrative follow-ups can organically boost lead conversion from 3% to 4.5%. When AI-powered CRM systems save a sales representative 15 hours a week in administrative data entry, that recovered time is immediately redirected into relationship building and active deal management. Additionally, AI-driven pricing optimization can dynamically adjust to market conditions in real-time, increasing profit margins by up to 12%, while AI-enabled onboarding processes cut sales training time by 50%. In many B2B environments, this sales enablement is amplified by AI sales engineers that auto-generate RFP responses, compressing deal cycles even further.
Industry-Specific Yields and Benchmarks
To establish a compelling and realistic business case, financial modeling must utilize benchmarks relevant to the organization's specific sector. Automation yield varies drastically depending on the regulatory environment, transaction volume, and operational complexity of the industry.
Healthcare Administration
The healthcare sector, long burdened by staggering administrative complexity and regulatory demands, is currently adopting AI at 2.2 times the rate of the broader economy. The ROI calculations in this sector extend far beyond immediate financial returns to encompass care quality, patient outcomes, and clinical risk avoidance. Hospitals deploying AI workflow automation report a massive return of $3.20 for every $1 spent, with payback periods frequently realized within just 14 months.
Administrative automation is profoundly effective in this environment. AI systems can automate up to 30% of administrative tasks, freeing up 13% to 21% of nurses' time—equating to an additional 240 to 400 hours per nurse, per year, dedicated directly to patient care. Furthermore, predictive machine learning algorithms integrated into Electronic Health Records (EHR) have demonstrated the ability to cut hospital readmission rates by 15-20%, saving billions in avoidable healthcare costs and government penalties. Overall, cost-benefit analyses in healthcare show an average ROI of 734% within just two years of implementation.
Real Estate and Mortgage Finance
The mortgage and real estate industries are highly susceptible to macroeconomic volatility, interest rate fluctuations, and crushing documentation burdens. The integration of predictive analytics and workflow automation has moved from experimental to structurally essential. Firms employing AI for lead generation and follow-up report up to a 300% increase in lead volume and a 40% gain in conversion rates.
On the operational side, automating high-volume, low-complexity tasks within the loan origination process—such as document extraction, categorization, and compliance checking—drastically cuts the cost-to-serve and improves cycle times. Furthermore, AI-powered Automated Valuation Models (AVMs) have refined property pricing accuracy immensely, achieving error rates as low as 2.8%, compared to 10-15% just five years ago, significantly reducing portfolio exposure and risk for commercial lenders. The AI real estate market is projected to grow from 2.9 billion in 2024 to over 41 billion by 2033, underscoring a permanent structural shift.
Telecommunications and Corporate Education (LMS)
In knowledge-heavy industries, high-tech sectors, and corporate learning environments, the adoption of Learning Management Systems (LMS) coupled with workflow automation presents massive cost-avoidance opportunities. Implementing a robust, automated LMS can save an organization up to 60% on traditional training costs by eliminating travel, printing, and instructor fees.
The global LMS market is projected to reach $61.8 billion by 2032, driven largely by the need for standardized compliance training in sectors like telecom and manufacturing. By 2024, nearly half of all LMS tools are projected to feature AI enablement, allowing for automated course enrollment, deadline management, reporting, and highly personalized training paths. This automation vastly improves employee engagement, ensures regulatory compliance, and accelerates speed-to-competency for new hires.
Advertising, Gaming, and High-Tech
In fast-moving sectors like advertising, gaming, and software development, time-to-market is the primary currency. Automation in software testing, code generation (via AI coding assistants), and creative asset variations allows technology and advertising professionals to save an average of 66 minutes per day. This recovered time is injected directly back into creative strategy, game design, and complex problem-solving, dramatically increasing product iteration speeds and output quality. At the same time, leaders in these sectors must guard against AI-fueled technical debt by following disciplined practices like those outlined in AI vs. Debt: Stop Your Code from Becoming a Time Bomb, so today’s speed gains don’t become tomorrow’s hidden liability.
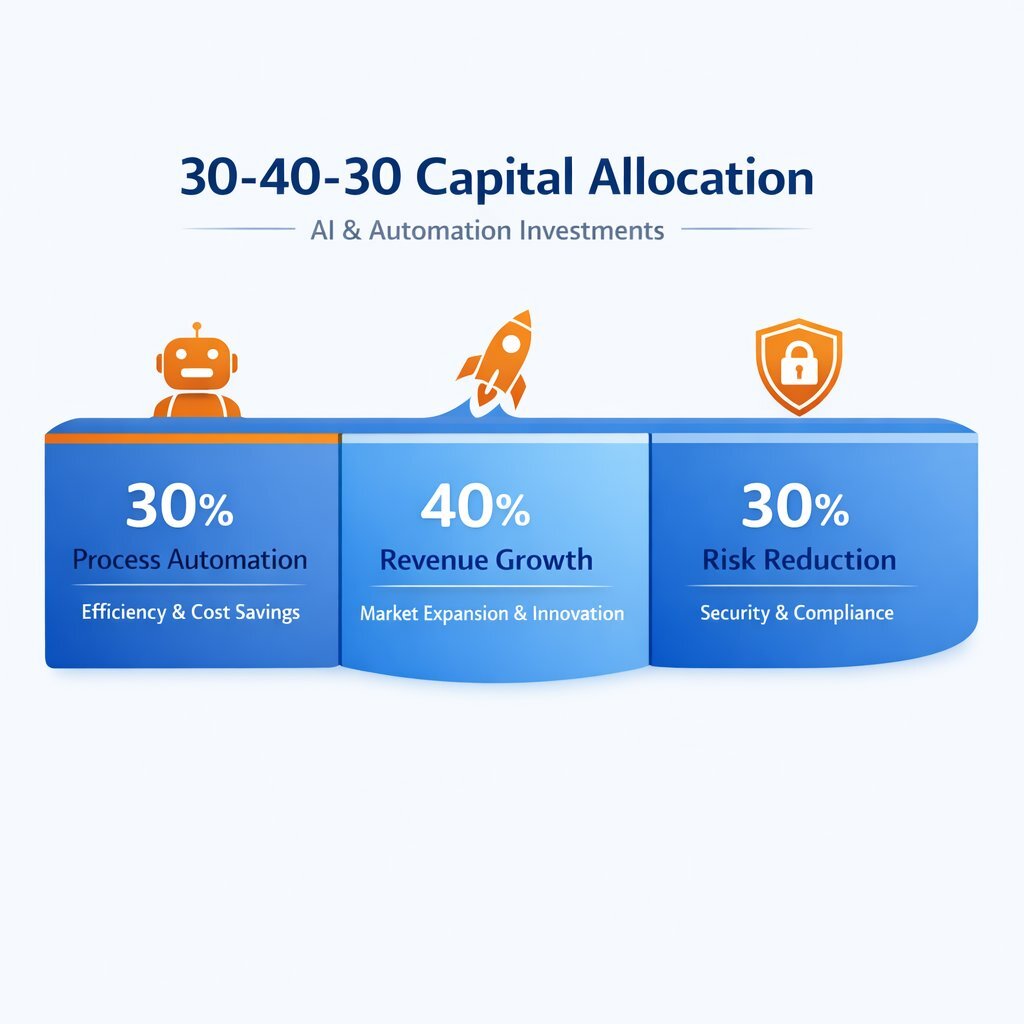
The 30-40-30 Capital Allocation Strategy
When presenting the business case for custom automation to the board of directors, financial leaders must architect the funding request to balance immediate operational risk with long-term strategic growth. Deploying capital haphazardly into AI initiatives often leads to stalled pilot programs. Financial consulting experts and venture capital analysts suggest utilizing the structured 30-40-30 allocation model for AI and enterprise automation investments:
First, 30% of the automation budget should be allocated to Process Automation. This portion targets the essential "quick wins." Initiatives like automating accounts payable, standardizing expense management, or streamlining CRM data entry yield rapid, highly visible results. These projects replace manual labor with automated systems, creating immediate cost savings that serve to fund the broader, more complex automation journey.
Second, the largest portion of capital—40%—should be directed toward Revenue Growth Initiatives. This encompasses tools that directly impact the top line, such as predictive analytics for dynamic pricing, customer behavior modeling, lead scoring, and demand forecasting. While these complex algorithms take longer to mature and require high-quality data sets, their ROI ceiling is virtually limitless, fundamentally shifting the company's competitive positioning.
Finally, the remaining 30% must be allocated for Risk Reduction. This final allocation focuses on a defensive organizational posture. It includes automated anomaly detection, robust compliance tracking systems, and advanced cybersecurity protocols. In the context of risk management, the ROI is measured in catastrophic financial losses and reputational damage avoided. Many organizations now use internal AI compliance bots to continuously monitor code, content, and data flows, turning compliance from a periodic audit into a real-time safety net.
Furthermore, deploying these initiatives in deliberate, sequenced stages—beginning with a 90-day proof-of-concept focused on a low-risk area before expanding into full-scale enterprise deployment over 12 to 18 months—has been shown to generate 25-40% better ROI than massive, all-at-once technological overhauls. For many small and mid-sized businesses, this phased approach mirrors the 90-day roadmap recommended in practical guides to SMB AI adoption, use cases, and costs, helping them move quickly without betting the company.
The "They Ask, You Answer" Imperative for Procurement
When evaluating external partners for custom software engineering and automation deployment, financial leaders must demand complete, unfiltered transparency. Drawing upon the renowned "They Ask, You Answer" (TAYA) business philosophy, organizations should insist that vendors directly address the most pressing, uncomfortable questions during the procurement phase rather than obfuscating behind marketing jargon. At the core of this methodology are the "Big 5" topics—the specific categories of questions active buyers prioritize.
1. Cost and Financial Realities Vendors must articulate the exact variables that influence the price of a custom build, moving beyond vague estimates to define the absolute boundaries of the Total Cost of Ownership. Building trust requires honesty about pricing ranges, expected maintenance costs, and any potential integration fees, preventing future budgetary shocks.
2. Problems and Drawbacks A trustworthy technology partner will openly discuss the potential problems or drawbacks of their proposed tech stack. They must outline specific operational environments where their solution is not a suitable fit, which actively prevents bad-fit clients from investing in systems that will inevitably fail to deliver ROI.
3. Honest Comparisons Before committing capital, financial teams should expect vendors to objectively evaluate custom solutions against leading off-the-shelf alternatives. By disclosing any inherent biases and comparing strengths and weaknesses openly, the vendor establishes themselves as a strategic partner rather than a mere order-taker.
4. Best of Lists and Practices Vendors should proactively share the best practices that yield the most successful results when deploying their software. This includes advising on which applications are best suited for different corporate scenarios, ensuring the client maximizes the utility of the investment.
5. Objective Reviews The evaluation should include honest, objective assessments of prior implementations. Because 95% of buyers read reviews before purchasing, transparently discussing how previous automation rollouts performed—including what went wrong and how it was fixed—is highly influential in building executive confidence.
By demanding this level of radical transparency aligned with the TAYA framework, CFOs filter out vendors who prioritize the initial sale over the long-term solution, ensuring they partner with engineers capable of delivering the promised financial outcomes.
Conclusion and Strategic Next Steps
The integration of artificial intelligence and workflow automation is no longer an experimental luxury reserved for massive tech conglomerates; it is a structural necessity for maintaining competitive margins in the modern B2B landscape. However, treating automation merely as "cool tech" guarantees its inclusion in the 95% of enterprise initiatives that fail to deliver meaningful business value.
To succeed, financial leaders must ruthlessly apply rigorous frameworks to quantify value. By mastering the Double-Click framework to translate abstract "hours saved" into hard operational currency, calculating stringent payback periods based on comprehensive Total Cost of Ownership, and recognizing the long-term economic superiority of custom software architectures over generic, compounding SaaS subscriptions, CFOs can transform automation from a speculative expense into a highly reliable, yield-generating corporate asset.
Next Steps for Financial Leaders:
- Audit Current Manual Workflows: Identify the top three most labor-intensive processes within the finance, operations, or sales departments that suffer from high error rates or slow cycle times.
- Calculate the Baseline Cost: Use the formula outlined in this report (Task Volume × Time Spent × Fully Loaded Hourly Rate) to determine the exact annual financial drain of these legacy processes.
- Conduct a TCO Analysis: Solicit proposals for both an off-the-shelf SaaS solution and a custom-built application, mapping their respective costs, licensing fees, and maintenance requirements over a detailed 5-year horizon.
- Engage an Engineering Partner: Consult with specialized development firms—such as Baytech Consulting—that prioritize agile deployment, open-source infrastructure stacks, and transparent communication to scope the financial feasibility of a high-ROI custom solution.
Recommended Reading
- How to Calculate the Payback Period
- https://www.auxiliobits.com/blog/the-cfos-guide-to-automation-investment-and-payback-periods/
- https://www.bcg.com/publications/2025/how-finance-leaders-can-get-roi-from-ai
Frequently Asked Questions
How do we accurately measure "hours saved" effectively without overstating the ROI to the executive board? To prevent inflated ROI projections that erode financial credibility, organizations must avoid using broad estimates or theoretical maximums. Instead, measure the exact time it currently takes to execute a specific task, multiply that by the task's true annual volume, and then apply a conservative automation yield (e.g., assume 80% or 90% of the task is automated, rather than an unrealistic 100%, to account for necessary human-in-the-loop exception handling). Finally, multiply those hours by the specific, fully loaded hourly compensation rate of the employees performing the task. Critically, to realize the actual financial value of those saved hours, the business must systematically verify that the recovered time is actively reallocated to strategic, revenue-generating, or high-value activities, rather than simply being absorbed as idle time by the workforce.
What is the typical payback period for custom automation, and when should we be concerned? The payback period for a well-scoped custom automation project should typically fall between four to six months. If financial modeling projects a payback period stretching beyond 12 to 18 months, the CFO should be highly concerned. This extended timeline often indicates that the project is over-engineered, the target process does not have enough volume to justify automation, or the chosen technology stack is unnecessarily expensive. In such cases, the organization should pivot toward a smaller, more focused proof-of-concept to validate the assumptions before committing broader capital.
Why does custom software often have a better ROI than cheaper off-the-shelf software? While off-the-shelf software has a lower initial barrier to entry, its Total Cost of Ownership (TCO) scales poorly over time. Off-the-shelf tools rely on compounding, per-user subscription models, meaning that as a company grows, it is penalized financially for adding headcount. Furthermore, because generic software does not match unique business workflows perfectly, companies are forced to spend heavily on manual workarounds, shadow IT, and complex integrations. Custom software requires a higher initial capital expenditure but operates on a stabilized, predictable run-rate, yielding a much higher ROI (up to 300% more) over a three-to-five-year period by perfectly mapping to the business and eliminating recurring license bloat.
About Baytech
At Baytech Consulting, we specialize in guiding businesses through this process, helping you build scalable, efficient, and high-performing software that evolves with your needs. Our MVP first approach helps our clients minimize upfront costs and maximize ROI. Ready to take the next step in your software development journey? Contact us today to learn how we can help you achieve your goals with a phased development approach.
About the Author

Bryan Reynolds is an accomplished technology executive with more than 25 years of experience leading innovation in the software industry. As the CEO and founder of Baytech Consulting, he has built a reputation for delivering custom software solutions that help businesses streamline operations, enhance customer experiences, and drive growth.
Bryan’s expertise spans custom software development, cloud infrastructure, artificial intelligence, and strategic business consulting, making him a trusted advisor and thought leader across a wide range of industries.