
The Future of Developer Productivity: Metrics That Matter
April 10, 2026 / Bryan Reynolds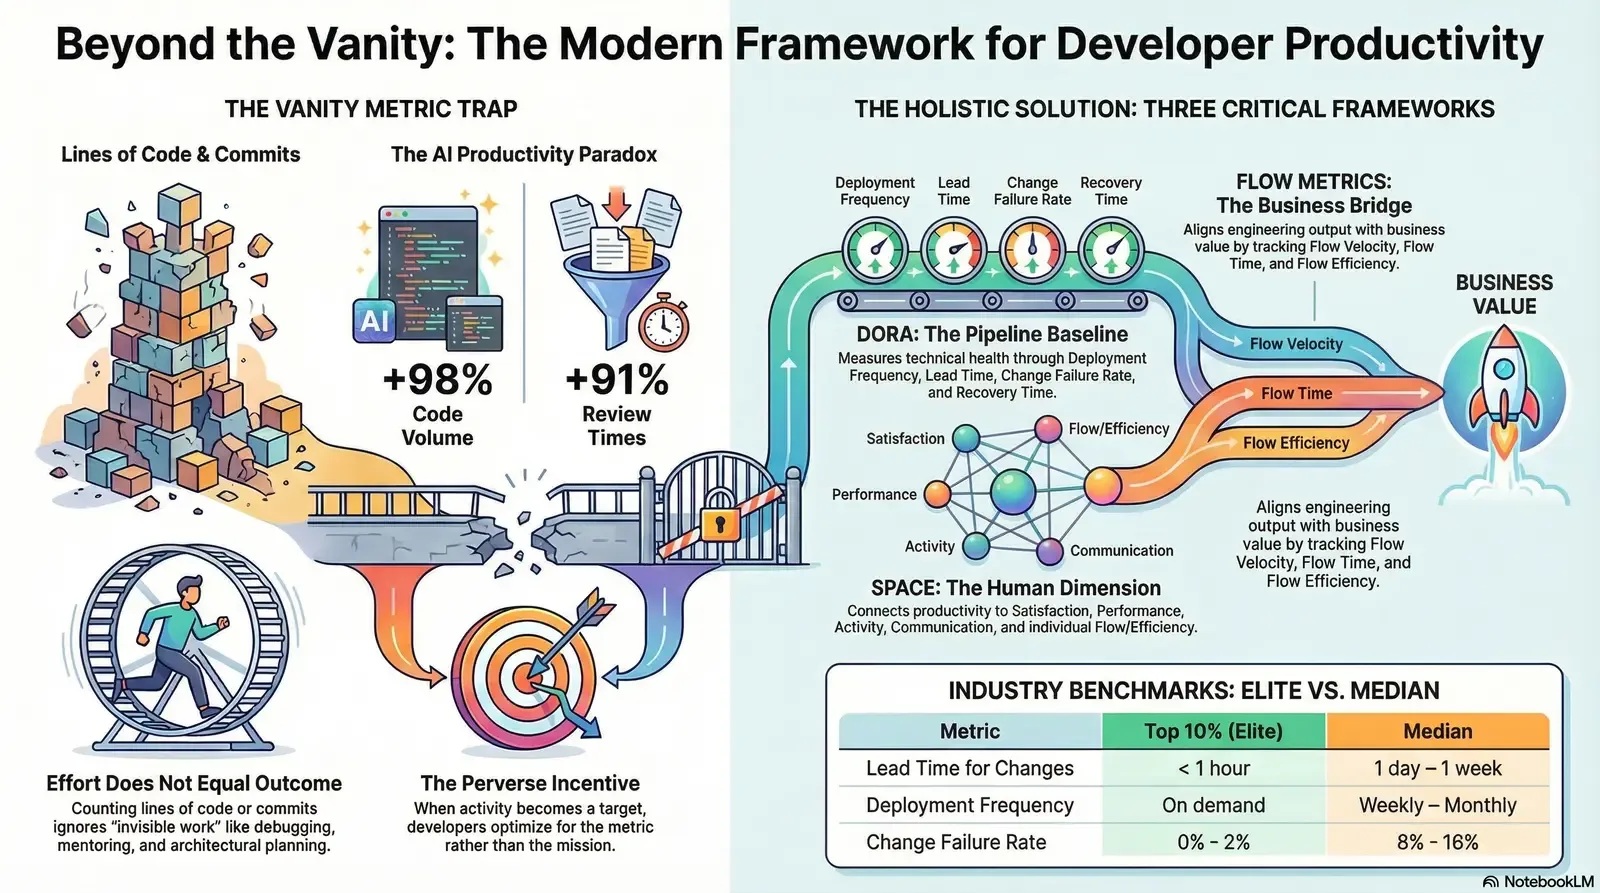
The Future of Developer Productivity: Metrics That Actually Matter
For enterprise technology leaders, accurately measuring software developer productivity remains one of the most complex organizational challenges of the modern era. Executives—from visionary Chief Technology Officers driving digital transformation to strategic Chief Financial Officers demanding quantifiable returns on research and development investments—increasingly require transparent, data-driven dashboards to quantify the impact of their engineering organizations. Driven Heads of Sales and Innovative Marketing Directors depend on reliable delivery pipelines to promise new capabilities to the market. However, unlike manufacturing or traditional sales operations, software engineering is a highly complex, creative, and adaptive system. In this domain, raw output does not automatically equate to business value, and typing speed does not accurately reflect problem-solving capability.
The enterprise software industry is currently navigating a profound measurement paradigm shift. Fueled by the rapid integration of Generative AI coding assistants into the software development life cycle and high-profile industry debates over metric validity, organizations are aggressively moving away from easily gamified vanity metrics. The focus has shifted entirely toward holistic, multi-dimensional frameworks that measure systemic throughput, operational stability, end-to-end flow efficiency, business impact, and human well-being. This exhaustive research report investigates the metrics that enterprise leaders must use to accurately measure developer productivity, dissects the catastrophic failure of traditional activity-based tracking, and outlines how modern frameworks—specifically the DevOps Research and Assessment (DORA) metrics, the SPACE framework, and Flow metrics—can be synthesized to drive sustainable, enterprise-grade engineering performance.
The Vanity Metric Trap: Why Effort Does Not Equal Outcome
Historically, the software industry attempted to measure developer productivity through highly individualized, effort-based activity metrics. Organizations tracked lines of code written, the number of commits pushed to version control, hours logged in tracking systems, or Agile story points completed per sprint. These metrics represent the ultimate "vanity metric trap." They are easily quantifiable proxies that provide a false sense of managerial control while completely failing to capture the actual value delivered to the end-user. More dangerously, these metrics actively encourage destructive behaviors and degrade overall software quality.
The McKinsey Controversy and the Danger of Measuring Activity
The debate over the validity of activity metrics reached a boiling point in late 2023 and early 2024 following the publication of a widely circulated report by the management consulting firm McKinsey & Company. The report suggested that developer productivity could be successfully operationalized and measured using effort-based metrics, attempting to simplify engineering metrics for C-suite executives in mega-corporations. The response from the global software engineering community was swift, unanimous, and highly critical.
Industry luminaries, including Agile manifesto co-author Kent Beck and pragmatism advocate Gergely Orosz, publicly dismantled the report's methodology, pointing out that measuring effort earlier in the "effort-output-outcome-impact" cycle creates inherently perverse incentives. When developers are evaluated by lines of code or pull request volume, they inevitably optimize for the wrong proxy. A senior engineer might spend eight hours meticulously debugging a critical production issue, analyzing architectural dependencies, and ultimately resolving a massive memory leak by deleting fifty lines of code and adding just one. Under a simplistic activity-based measurement system, this highly valuable, system-saving work appears entirely unproductive.
Furthermore, tracking individual Agile story points leads directly to systemic gamification. Story points were originally conceived as a relative measure of complexity to aid in capacity planning, representing mythical "ideal days" of effort. When leadership weaponizes these points as a productivity target, teams naturally respond by artificially inflating their point estimations to appear more productive, rendering the entire metric useless for actual project forecasting and capacity planning.
Activity metrics operate under a fundamentally flawed "manufacturing mindset." This mindset assumes that constant typing equals constant value creation, treating software engineers like factory line workers. In reality, the most productive developers often spend the majority of their time reading legacy code, architecting scalable solutions, reviewing peer work to prevent future technical debt, or communicating across team dependencies to ensure alignment. When a measurement system punishes these vital collaborative activities in favor of sheer output, the organization suffers from increased knowledge silos, deteriorating code quality, and elevated systemic risk. For leaders wrestling with legacy systems, complementary approaches like the Silent Enterprise pattern for modernizing legacy applications with AI overlays can help them rethink value beyond raw activity.
The Perception-Reality Gap in the AI Era
The danger of relying on effort and activity metrics has been further exposed by recent studies on Generative AI. A July 2025 study by METR highlighted an alarming perception-reality gap regarding developer speed. In a randomized controlled trial testing experienced open-source developers on real repository issues, developers using AI coding assistants completed tasks 19% slower than the control group. However, despite objective measurements proving they were slower, the AI-assisted developers subjectively believed the tools had improved their speed by 20%.
This paradox reveals how deeply broken traditional software engineering metrics have become. Activity increases, output feels faster due to the rapid generation of boilerplate code, yet the actual outcome—the successful completion of a complex task—stagnates or degrades. What looks like heightened productivity on a simplistic dashboard may actually be slower delivery wrapped in inflated activity metrics. For organizations exploring copilots and AI overlays, resources such as the guide on designing and deploying trustworthy AI copilots instead of simple chat widgets can help align AI initiatives with real outcomes.
The Foundational Framework: DORA Metrics in the Enterprise
To move definitively beyond vanity metrics, enterprise leaders must adopt a composite, data-driven approach. The industry standard for establishing an operational baseline is the framework developed by the DevOps Research and Assessment (DORA) team, originally a research group that was later acquired by Google Cloud. DORA metrics provide an objective, system-level assessment of a team's software delivery performance, focusing strictly on the mechanical health, throughput, and stability of the software delivery pipeline. Extracted directly from version control systems, continuous integration and continuous deployment (CI/CD) tools, and incident management platforms, DORA metrics remove human bias from performance evaluation.
Historically, DORA tracked four core metrics. However, extensive research updates in the 2024 and 2025 State of DevOps and State of AI-Assisted Software Development reports have expanded, refined, and modernized this framework to reflect the realities of modern enterprise development.
The Five Pillars of Delivery Performance
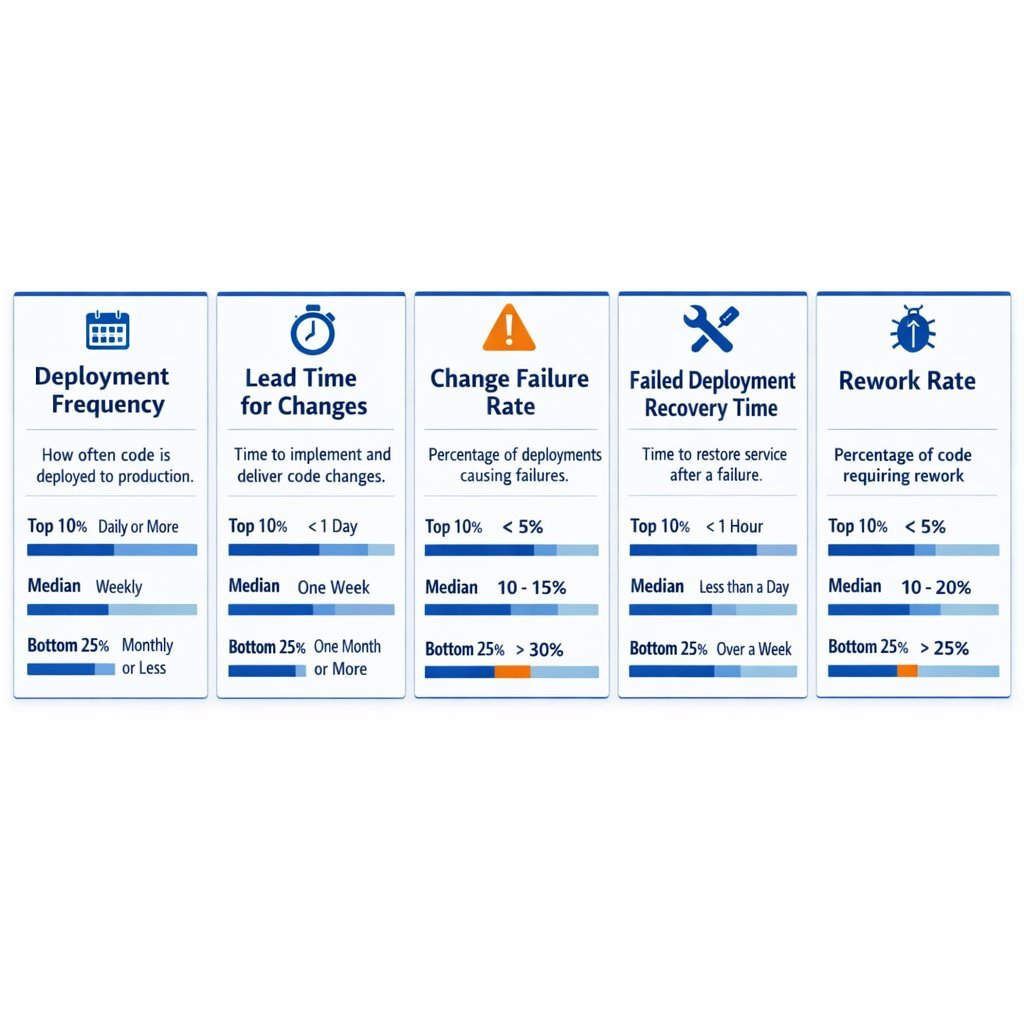
The modern DORA framework utilizes five specific metrics to evaluate software delivery capability, balancing the inherent tension between speed and stability:
The first metric is Deployment Frequency, which measures how often an organization successfully releases code to a production environment. This metric acts as an indicator of DevOps efficiency and the continuous delivery capability of the team. Elite organizations deploy on-demand, executing multiple deployments per day. High deployment frequency requires mature CI/CD pipelines, robust automated testing suites, and a culture that supports small, incremental changes rather than massive, high-risk, quarterly release trains.
The second metric is Lead Time for Changes, capturing the total duration from the moment a code commit is made by a developer to the moment that specific change successfully runs in the production environment. This metric evaluates the efficiency and friction within the development and release pipeline. Organizations with shorter lead times can respond to market changes and customer feedback with high agility. Elite teams consistently achieve a lead time of less than one day.
The third metric, Change Failure Rate, shifts the focus to stability. It represents the percentage of deployments that cause a failure in production, necessitating immediate remediation such as a hotfix, rollback, or patch. This metric serves as a critical quality gate, indicating whether the pursuit of speed is compromising the user experience. Top-performing elite teams maintain a change failure rate below 15%, and frequently below 5%.
The fourth metric represents organizational resilience. Previously known as Mean Time to Recovery (MTTR), the 2024 DORA Report officially renamed this metric to Failed Deployment Recovery Time. This reframing is highly intentional; it shifts the interpretation from simply "fixing failures" to improving operational momentum. Fast recovery after a failed deployment supports delivery flow, helping teams return to a state where they can deploy again sooner. This metric excludes general production incidents caused by unpredictable network outages or hardware faults, focusing purely on the recovery from a bad software release. Elite teams recover from failed deployments in less than one hour.
The fifth and newest metric, officially added to the framework in recent updates, is the Rework Rate. While the Change Failure Rate measures catastrophic deployments that cause outages, the Rework Rate captures the percentage of deployments that are unplanned but occur specifically to fix user-facing bugs. This distinction is vital for enterprise leaders. Rework Rate reveals the ongoing friction, technical debt, and quality leakage that silently erodes team velocity over time. Together with the Change Failure Rate, it provides a comprehensive picture of true delivery stability.
The Shift from Tiers to Granular Distributions
For years, organizations judged themselves against simple categorization tiers: Low, Medium, High, and Elite. The 2024 and 2025 DORA research marks a departure from these rigid classifications in favor of granular performance distributions. The simple tiers served a purpose but often oversimplified the complex reality of enterprise software development.
Furthermore, recent data indicates a significant shift in global performance clusters. The "High Performance" cluster has shrunk notably, dropping from 31% of respondents in 2023 to just 22% in 2024, while the "Low" cluster grew to 25%. Even more surprisingly, throughput and quality metrics are beginning to move independently. For the first time, data showed that the "medium" performance cluster reported a lower change failure rate than the "high" performance cluster.
By providing granular distributions, enterprise leaders can set realistic, data-backed improvement targets rather than chasing arbitrary elite status across all categories simultaneously. For example, understanding that only 9.4% of teams globally achieve a Lead Time for Changes of less than one hour allows an organization currently operating at a one-month lead time to target the median (one day to one week) as a stepping stone.
| Performance Metric | Top 10% | Top 25% | Median | Bottom 25% |
|---|---|---|---|---|
| Lead Time for Changes | < 1 hour | < 1 day | 1 day – 1 week | > 1 month |
| Deployment Frequency | On demand | Daily – Weekly | Weekly – Monthly | 1 to 6 months |
| Change Failure Rate | 0% - 2% | 3% - 7% | 8% - 16% | > 25% |
| Rework Rate | < 2% | 3% - 6% | 7% - 12% | > 20% |
Table 1: 2025 DORA Metrics Granular Distributions. Data aggregated from the 2025 State of AI-Assisted Software Development Report, illustrating realistic industry benchmarks across delivery throughput and stability.
The AI Productivity Paradox: A Systems-Level Crisis
The granular tracking of DORA metrics has proven indispensable for uncovering the most significant phenomenon currently disrupting enterprise software engineering: the AI Productivity Paradox. As organizations race to equip their developers with Generative AI coding assistants, they expect to see a massive, corresponding surge in organizational software delivery performance. The empirical data tells a drastically different story.
Generative AI acts as a powerful, localized amplifier of individual output. Extensive telemetry from the 2025 DORA and Faros AI reports confirms that developers using AI experience a 21% increase in task completion and a staggering 98% increase in Pull Request volume. Developers are generating code faster than ever before. However, at the organizational level, downstream delivery metrics—Lead Time, Deployment Frequency, Change Failure Rate, and Failed Deployment Recovery Time—remain entirely flat, and in some cases, they are degrading.
The root cause of this paradox lies in the systemic bottlenecks that emerge when localized coding speed outpaces organizational review and deployment capacity. The surge in AI-generated code has overwhelmed human reviewers and automated quality gates. Consequently, Code Review Time has increased by 91%. Because AI makes it effortless to generate large blocks of code, Pull Request size has grown by 154%, creating severe cognitive overload for reviewers who must decipher the intent and security implications of code they did not write. As a direct result of these overwhelmed quality gates struggling with larger code diffs, Bug Rates have climbed by 9%. For teams exploring automation beyond coding, it is helpful to pair these insights with guidance on turning repetitive busywork into robust AI-powered workflows to avoid simply shifting bottlenecks elsewhere.
Despite this immense increase in workload complexity, with AI-augmented developers interacting with 47% more Pull Requests daily, the 2025 DORA report found no correlation between AI adoption and increased burnout or friction. Developers feel cognitive relief from avoiding boilerplate code and documentation searches, which offsets the stress of managing more concurrent workstreams. The stress indicators remain neutral, fundamentally changing what context switching means in modern environments.
To diagnose and overcome this paradox, organizations are leveraging advanced telemetry diagnostic tools like the GAINS (Generative AI Impact Net Score) framework. This framework forces organizations to look beyond the adoption phase to measure flow efficiency, quality, and structural alignment, mapping AI performance directly to business outcomes. The DORA 2025 report also identifies seven new organizational archetypes that explain how AI interacts with existing cultures. For instance, "Legacy Bottleneck" teams see their individuals code faster, but weak deployment systems eat up all the gains. In contrast, "Harmonious High-Achievers" utilize strong platform engineering foundations to ensure AI benefits spread smoothly across the entire organization.
For enterprise leaders, the mandate is clear: tracking individual AI usage or lines of AI-generated code is another descent into the vanity metric trap. Leaders must measure Rework Rate and system-wide throughput to ensure that the time saved by AI during coding is not completely lost during the QA and review phases. For small and mid-sized businesses, pairing these ideas with a practical AI adoption roadmap for SMBs can prevent over-investing in tools that never move real delivery metrics.
The Human Dimension: Decoding the SPACE Framework
While DORA provides essential, objective data on pipeline mechanics, it suffers from a critical limitation: it cannot measure context, culture, or the human condition. DORA explains what is happening within the system, but it fails to explain why it is happening. To achieve a holistic understanding of enterprise engineering performance, organizations must implement the SPACE framework.
Developed in 2021 by a consortium of researchers from Microsoft, GitHub, and the University of Victoria—including Dr. Nicole Forsgren, a primary author of the original DORA research—the SPACE framework is a multi-dimensional model asserting that sustainable productivity is inextricably linked to developer well-being, team dynamics, and work environment. The framework actively challenges the myth that productivity is solely about individual performance or engineering systems.
The SPACE framework evaluates teams across five distinct dimensions:
Satisfaction and Well-being: This dimension evaluates how fulfilled developers feel regarding their work, tools, and team culture, alongside their physical and mental health. Extensive research, including studies from Oxford University, conclusively links higher employee satisfaction to significant increases in productivity and efficiency. Conversely, developer burnout is a massive organizational risk; data indicates that 83% of software developers feel burnout due to heavy workloads, unclear expectations, and constant interruptions. Measuring satisfaction through qualitative surveys acts as a leading indicator; a decline in satisfaction often signals upcoming burnout and an inevitable drop in delivery performance.
Performance: This dimension emphasizes evaluating engineering efforts based on outcomes rather than sheer outputs. Writing thousands of lines of code quickly is irrelevant if the code does not reliably execute its intended function or deliver customer value. Performance is typically captured through quality metrics like defect rates, reliability scores, and customer satisfaction indexes.
Activity: Activity represents a count of actions or outputs completed during the course of work, such as commits, pull requests, deployments, or design documents produced. While the SPACE framework acknowledges Activity, it warns strongly against using it in isolation. Because it cannot easily quantify invisible work like brainstorming, architectural planning, or assisting a junior colleague, activity metrics must be heavily contextualized by the other four dimensions.
Communication and Collaboration: Software development is inherently a team-based endeavor. This dimension captures how people and teams coordinate their efforts and share knowledge. Effective communication and transparency can save knowledge workers up to 25 hours per week. Because collaboration is difficult to measure directly, organizations use proxy metrics such as the quality and speed of code reviews, the ease of discovering internal documentation, and the time required to successfully onboard new developers.
Efficiency and Flow: Flow refers to an individual developer's state of being "in the zone," capable of executing deep work with minimal interruptions. Efficiency is measured at the system level, tracking the progress of software through the organization. For individuals, this dimension tracks the amount of uninterrupted focus time available during the week. For teams, it involves identifying the number of handoffs between departments and the total wait time embedded in the workflow.
Implementing the SPACE framework requires a mature blend of automated system telemetry and qualitative survey data, such as pulse surveys and eNPS tracking. To avoid the pitfall of focusing on a single measure, experts recommend that enterprise leaders select at least three metrics spanning across three different SPACE dimensions, tailoring the benchmarks to their unique organizational goals.
Bridging IT and the Business: Flow Metrics and Value Stream Management
If DORA measures the mechanical speed of the pipeline and SPACE measures the health of the humans operating it, Flow Metrics serve to bridge the persistent gap between engineering execution and business strategy. Conceived by Dr. Mik Kersten, the Flow Framework treats software delivery as a continuous value stream, deliberately abstracting highly technical details so that non-technical business stakeholders—like the CFO or the Head of Sales—can clearly understand where investments are going and where bottlenecks lie.
The Flow Framework requires organizations to shift from a traditional project-centric mindset to a product-oriented model. It operates on the principle that all software-related work must create or protect business value. To measure this, work is categorized into four distinct Flow Items: Features (new business value), Defects (quality fixes), Risks (security and compliance work), and Debt (architectural improvements to alleviate future impediments).
Enterprise leaders utilize five core Flow metrics to analyze these items:
- Flow Velocity: The number of Flow Items completed over a specific time period. It acts as a baseline guide to whether value delivery is accelerating or decelerating.
- Flow Time: The total time it takes for an item to move from "work start" (when a request is accepted into the backlog) to "work complete" (when it is running in production). This end-to-end perspective reveals how quickly the organization transforms business needs into actual results, encompassing both active development and all wait times.
- Flow Efficiency: The ratio of active value-adding work time versus the total cycle time (which includes all wait states and delays).
- Flow Load: The total number of Flow Items currently in progress across a value stream. Based on queuing theory and Little's Law, managing Flow Load is critical; high levels of work-in-progress lead to massive context switching, burning out teams and severely increasing Flow Time.
- Flow Distribution: The allocation of engineering capacity across the four Flow Items. This visualizes the trade-offs being made—for example, showing if a massive push for new Features has completely halted work on resolving critical Security Risks or paying down Technical Debt.
The Flow Efficiency Revelation
Among these metrics, Flow Efficiency provides the most startling revelation for enterprise leaders. Industry benchmarking data reveals that most enterprise product teams operate at an abysmal 15% to 25% Flow Efficiency. This metric dictates that for every one hour of actual, active development work, a feature spends three to five hours sitting completely idle.
The low efficiency is not a result of lazy developers; it is a symptom of broken organizational systems. Work sits in queues waiting for managerial approval, waiting for cross-team dependencies to clear, waiting for specialized QA testing, or waiting for security sign-offs. A team can have an incredibly fast DORA Lead Time—measuring only the time from code commit to deployment—but if a feature request spends two months sitting in a product backlog before the first line of code is written, the business still experiences agonizingly slow delivery. Measuring Flow Efficiency exposes the critical difference between organizational theater (busy teams) and true capability (effective systems).
Tailoring Productivity Metrics Across Enterprise Roles
A common failure mode in major enterprise metrics initiatives is attempting to apply a single, unified dashboard across the entire company. Productivity means vastly different things depending on where an individual sits within the organizational hierarchy. An effective measurement strategy must align the appropriate metrics with the corresponding roles, ensuring that each layer of management possesses the data necessary to execute their specific responsibilities without micromanaging the layer below.
The Executive Level: The Visionary CTO and Strategic CFO
At the executive tier, metrics must definitively tie engineering output to business impact and financial performance. The CEO and CFO are rarely concerned with the raw volume of code deployed or the specifics of branch merging strategies; their primary focus is on revenue growth, cost savings, customer retention, and capital allocation.
Executives must rely heavily on Flow Metrics to gain a macro-perspective of the organization. By monitoring Flow Distribution, a CTO can empirically demonstrate to the CFO that the business is adequately funding innovation (Features) while maintaining necessary risk profiles (Debt and Risk), rather than sinking all capital into maintenance. Flow Time provides a clear metric for speed-to-market, allowing sales and marketing directors to confidently forecast product launches. Furthermore, linking these delivery metrics to strict Business Value KPIs—such as tracking if a new feature release directly correlated to a 15% increase in checkout completions—closes the loop between R&D spend and corporate strategy. Translating metrics like "Weekly Time Loss" due to inefficient tooling into hard dollar costs provides executives with a compelling ROI calculation for authorizing investments in platform engineering. For organizations building defensible products, this is closely tied to the idea that generic AI wrappers are not enough and true moats come from owning critical workflows and data.
The Management Level: Engineering Managers and Directors
Engineering Managers are responsible for shaping the environment where the actual work happens. They serve as the frontline defense against developer burnout, scope creep, and systemic friction. Their metrics must focus on the health and efficiency of the systems their teams operate within.
Managers should focus intensely on the intersection of DORA metrics and the SPACE framework. Relying on Change Failure Rate and Lead Time for Changes allows managers to identify systemic bottlenecks and quality degradation in real-time. Simultaneously, tracking Developer Satisfaction (through CSAT or NSAT scores) and analyzing the volume of Weekly Focus Time acts as an early warning system for cognitive overload. By treating developer experience as a leading indicator of delivery performance rather than a "soft" human resources metric, engineering managers can protect their teams' flow state and ensure the long-term sustainability of engineering velocity. For managers wrestling with legacy bottlenecks, patterns like the AI Sidecar pattern for extending legacy systems safely with RAG and Text-to-SQL can unlock better flow without risky rewrites.
The Individual Contributor: The Software Developer
For the individual software developer, productivity is deeply subjective, highly personal, and directly tied to the elimination of toil. A developer feels productive when they are empowered to achieve a deep flow state without constantly fighting brittle infrastructure, navigating bureaucratic approval chains, or waiting for environments to provision.
Developers do not need to be managed by Flow Distribution or global MTTR; they require localized metrics that impact their daily workflow. Key metrics at this level include Local Build Times, Pull Request Review Wait Times, and the Time to First Release for newly onboarded engineers. When developers are burdened with heavy handoffs across specialized teams—such as throwing code over the wall to isolated security or QA departments—their perceived productivity plummets, even if their individual coding speed remains high. Empowering developers with visibility into their own team's cognitive load and bottleneck metrics allows them to self-organize and advocate for necessary technical debt reduction.
Architecting the Measurement Infrastructure: Tooling and the Azure DevOps Challenge
Defining the right metrics is only half the battle; extracting, synthesizing, and displaying that productivity data in a massive, legacy enterprise environment is a formidable technical challenge. Engineering data rarely lives in a single repository. It is scattered across highly fragmented toolchains: Jira or Azure Boards for work items, GitHub or GitLab for source control, Jenkins or Azure Pipelines for CI/CD, and PagerDuty or ServiceNow for incident management.
For a vast number of B2B enterprises, particularly in finance, healthcare, and telecom, Microsoft Azure DevOps (ADO) serves as the backbone of their engineering infrastructure. However, extracting raw DORA and Flow metrics natively from an Azure DevOps environment presents significant technical hurdles that often require substantial custom engineering.
While Azure DevOps provides a feature called "Analytics Views" to pull data smoothly into Power BI for dashboarding, these views are primarily limited to Azure Boards (work items). Crucially, Analytics Views do not natively support the extraction of pipeline, test, or deployment data. This severe limitation makes it incredibly difficult to automatically calculate Lead Time for Changes or Deployment Frequency without relying solely on the hygiene of manual ticket updates within Azure Boards. Furthermore, defining dynamic organizational boundaries is complex; attempting to slice DORA metrics by agile team structures rather than rigid hierarchical Area Paths requires writing complex OData queries and utilizing advanced SQL, creating a heavy, ongoing maintenance burden for internal platform engineering teams.
To overcome these severe native limitations, modern enterprises are increasingly abandoning manual Power BI templates in favor of specialized software engineering intelligence platforms. Tools such as Faros AI, Axify, CodePulse, and DX are designed to integrate across the entire fragmented SDLC via APIs, acting as a single, unified pane of glass. These platforms offer vital capabilities:
- Cross-Platform Correlation: They seamlessly map a Jira planning ticket to a GitHub code commit, trace it through an Azure pipeline deployment run, and link it to a subsequent PagerDuty incident, allowing for the calculation of true, end-to-end Flow Time and Lead Time.
- Automated DORA Computation: They automatically identify the oldest commit in a deployment batch to accurately track lead times, and use incident links to automatically tag failed deployments, computing Rework and Change Failure Rates without manual data entry.
- Integrated Developer Experience Polling: They layer qualitative data directly over the quantitative telemetry by pushing automated, micro-pulse surveys directly into developer workflows via Slack or Microsoft Teams, effectively capturing the human dimensions of the SPACE framework.
Organizations seeking to build or integrate these robust telemetry systems often partner with specialized firms to navigate the complexities of legacy infrastructure. Baytech Consulting, specializing in custom software development and application management, exemplifies how a Tailored Tech Advantage is required in this space. Leveraging highly skilled engineers and enterprise-grade stacks—including Azure DevOps On-Prem, robust databases like Postgres and SQL Server, and modern orchestration layers utilizing Kubernetes, Docker, Harvester HCI, and Rancher—allows for the Rapid Agile Deployment of customized measurement infrastructure. By utilizing cutting-edge tech architectures, enterprises can ensure their telemetry platforms map precisely to their unique value streams, rather than forcing the organization to adapt its workflows to suit an inflexible, off-the-shelf dashboard tool. When these foundations are paired with secure integration patterns described in resources like the AI Firewall guide to stopping prompt injection and enforcing AI governance, leaders can safely bring advanced analytics and AI into their DevOps pipelines.
The Cultural Imperative: Psychological Safety and Avoiding Goodhart's Law
Deploying a productivity measurement framework is as much a cultural and psychological challenge as it is a technical one. If introduced poorly, engineering metrics can destroy organizational trust, erode psychological safety, and trigger the exact type of gamification leadership seeks to avoid.
The connection between culture and performance is not merely anecdotal; it is empirically proven. Extensive research, most notably Google’s Project Aristotle, revealed that teams characterized by high psychological safety were 35% more effective in delivering quality outcomes compared to those lacking a safe environment. The DORA reports continuously highlight that a culture of high trust and psychological safety is strongly correlated with work recovery, job satisfaction, and sustained software delivery throughput.
To successfully implement productivity metrics, enterprise leaders must adhere to strict behavioral principles to avoid triggering Goodhart's Law, which famously states that when a measure becomes a target, it ceases to be a good measure.
First, leadership must explicitly measure the system, not the individual. Using DORA metrics like Lead Time or Deployment Frequency to stack-rank individual developers during performance reviews is a catastrophic misstep. Because software development is inherently collaborative, evaluating individuals on team-based metrics incentivizes developers to hoard easy tasks, ignore peer code reviews, and refuse to mentor junior colleagues.
Second, metrics must be utilized as diagnostic tools, not rigid quotas. If a CTO mandates a strict "0% Change Failure Rate," development teams will simply halt all deployments, prioritizing self-preservation over innovation and entirely destroying the organization's flow velocity. Metrics should function as continuous pulse checks—leading indicators that prompt blameless, investigative conversations about why a specific bottleneck exists, rather than functioning as a punitive quota to be hit.
Finally, the implementation of these frameworks must embrace total transparency. Dashboards should not be hoarded by upper management and used as surveillance tools. The data must be visible to the engineers executing the work. When developers have real-time access to their own team's cognitive load metrics, wait times, and rework rates, they are empowered to self-optimize their workflows and provide empirical evidence to management when advocating for the necessary time to reduce technical debt. Teams that embrace this approach are well-positioned to adopt proactive practices like moving beyond static dashboards toward proactive AI systems that surface insights automatically, further strengthening trust and decision speed.
Conclusion
The future of enterprise developer productivity measurement demands a total abandonment of the industrial-era obsession with individualized activity tracking. Continuing to evaluate highly skilled software engineers by counting lines of code, pull request volumes, or hours worked creates a dangerous facade of productivity while actively harming software quality, distorting capacity planning, and destroying team morale.
Instead, enterprise leaders must adopt a nuanced, multi-dimensional, and system-oriented approach. By leveraging DORA metrics to ensure the mechanical delivery pipeline remains fast and stable, integrating the SPACE framework to monitor the critical human elements of developer well-being and collaboration, and applying Flow metrics to guarantee that engineering capacity translates directly into tangible business value, organizations can architect a sustainable, high-performance engineering culture.
In an era where Generative AI is drastically accelerating localized code generation while simultaneously threatening to overwhelm downstream review and quality systems, this holistic, systemic view is no longer a luxury—it is a baseline competitive necessity. Leaders must shift their focus away from tracking developer keystrokes and focus entirely on widening systemic bottlenecks, eradicating organizational friction, and empowering their engineering teams to deliver continuous value. For some organizations, that also means revisiting the underlying stack; moving toward a strategic .NET-first AI stack can make it easier to instrument, secure, and observe complex systems at scale.
Next Steps for Enterprise Leaders
- Audit Current Metrics: Immediately identify and eliminate vanity metrics tied to individual performance evaluations or stack-ranking.
- Map the Value Stream: Conduct a focused, 30-day assessment of a single product's Flow Efficiency to identify the largest areas of non-active wait time, handoff friction, and approval delays.
- Invest in Telemetry Integration: Objectively evaluate whether your current infrastructure (such as native Azure DevOps reporting) provides sufficient, automated visibility across the entire SDLC, or if a dedicated software engineering intelligence platform is required to unify your data and prevent manual reporting toil.
- Engage Expert Support: Consider partnering with highly skilled technical consultancies that specialize in enterprise-grade architecture, infrastructure orchestration, and application management to custom-craft a telemetry solution that securely fits your organization's unique operational environment.
Further Reading
- https://queue.acm.org/detail.cfm?id=3454124
- https://www.faros.ai/blog/key-takeaways-from-the-dora-report-2025
- https://www.planview.com/resources/articles/flow-framework-a-prescriptive-approach-for-transitioning-from-project-to-product/
Frequently Asked Questions
What developer productivity metrics actually matter in enterprise environments?
In complex enterprise environments, leadership must focus on system-level outcomes rather than individual outputs. The most critical metrics combine operational performance (utilizing DORA metrics such as Deployment Frequency, Lead Time, Change Failure Rate, Time to Restore, and Rework Rate), business value delivery (utilizing Flow metrics like Flow Efficiency, Velocity, and Time), and team health (utilizing the SPACE framework to measure Satisfaction, Collaboration, and Cognitive Load).
Why are lines of code, commits, or hours worked misleading?
These represent "vanity metrics" that measure sheer effort, not the actual outcome or value delivered to the customer. Relying on them incentivizes destructive behaviors, such as writing unnecessarily bloated code or splitting single logical tasks into multiple superficial commits to game the dashboard. Furthermore, these activity metrics completely fail to account for highly valuable "invisible" work, such as system architecture planning, peer mentoring, code review, and complex debugging, punishing developers for engaging in vital collaborative efforts.
Which metrics best reflect speed, quality, and value delivery?
For speed, organizations should track Lead Time for Changes and Deployment Frequency (DORA), alongside overall Flow Time (Flow Metrics). For quality, the focus should be on Change Failure Rate and the Rework Rate (DORA), combined with tracking Defects within the Flow Distribution. For value delivery, organizations must connect engineering outputs to specific Business Value KPIs (e.g., revenue impact, customer retention) and monitor overall Flow Efficiency to ensure rapid time-to-market.
How do DORA metrics compare to other productivity measures?
DORA metrics focus strictly on the speed and stability of the mechanical software delivery pipeline, providing an objective baseline of operational health. Flow metrics expand upon this by measuring the end-to-end business process (from the moment an idea is conceived by the business to the moment it is delivered to the customer). The SPACE framework adds the crucial human element, measuring developer satisfaction, well-being, and collaboration. Together, they form a complete, multi-dimensional picture of organizational health.
How can leaders measure productivity without encouraging bad behavior?
Leaders must rigidly adhere to measuring the system, not the individual. Metrics must be utilized exclusively as diagnostic tools to identify workflow bottlenecks and systemic friction, rather than as punitive targets or quotas tied to individual performance reviews or compensation. Cultivating a culture of profound psychological safety ensures that developers trust the measurement system, using the data to openly improve workflows and advocate for technical debt reduction rather than gaming the system out of fear.
What tools and dashboards help track enterprise engineering performance?
While native tools like Azure DevOps Analytics Views or Jira reports provide basic visualizations, they often struggle with cross-platform correlation and lack the ability to automatically calculate complex metrics like Flow Time. Enterprises are increasingly adopting specialized Software Engineering Intelligence (SEI) platforms—such as Faros AI, DX, or Axify—that integrate via APIs across the entire toolchain (source control, CI/CD, incident management) to provide a single, automated pane of glass, often incorporating automated qualitative surveys to capture the human dimensions of productivity.
How should productivity metrics differ across teams and roles?
Metrics must be tailored to the specific responsibilities of the role. Executives (CTOs, CFOs) require macro-level visibility into Flow Distribution and Business Value KPIs to ensure strategic alignment and ROI. Engineering Managers require visibility into DORA metrics and Developer Satisfaction to identify systemic bottlenecks and prevent team burnout. Individual Developers require localized metrics, such as Local Build Times and PR Review Wait Times, to help them reduce daily toil and maintain a productive flow state.
About Baytech
At Baytech Consulting, we specialize in guiding businesses through this process, helping you build scalable, efficient, and high-performing software that evolves with your needs. Our MVP first approach helps our clients minimize upfront costs and maximize ROI. Ready to take the next step in your software development journey? Contact us today to learn how we can help you achieve your goals with a phased development approach.
About the Author

Bryan Reynolds is an accomplished technology executive with more than 25 years of experience leading innovation in the software industry. As the CEO and founder of Baytech Consulting, he has built a reputation for delivering custom software solutions that help businesses streamline operations, enhance customer experiences, and drive growth.
Bryan’s expertise spans custom software development, cloud infrastructure, artificial intelligence, and strategic business consulting, making him a trusted advisor and thought leader across a wide range of industries.