
Operationalizing QA for Profit: 2025 Best Practices
December 24, 2025 / Bryan Reynolds1. Executive Manifesto: The New Economic Physics of Software
In the architectural blueprints of the modern enterprise, software has transcended its historical role as a utility. It is no longer merely the plumbing of the corporation; it is the product, the storefront, the supply chain, and the primary interface of customer value. For the Chief Financial Officer (CFO) and the Vice President of Engineering, this paradigm shift necessitates a fundamental re-evaluation of how software production costs are categorized and managed. Historically, Quality Assurance (QA) has been viewed through a lens of cost containment—a line item to be minimized, a hurdle to be cleared, or a tax on development speed. This perspective, born of the industrial manufacturing era, is mathematically obsolete in the digital economy.
This report posits a counter-intuitive but empirically validated thesis: The active suppression of software quality expenses is a driver of increased operational costs and reduced profitability. Conversely, rigorous, strategic investment in Quality Assurance—specifically the "Shift Left" methodologies advocated by Baytech Consulting—acts as a profit multiplier. It functions simultaneously as an efficiency engine, a revenue retention mechanism, and a catastrophic risk hedge.
The financial data supporting this thesis is robust. The Consortium for Information & Software Quality (CISQ) estimates the total cost of poor software quality (CPSQ) in the United States alone has ballooned to $2.41 trillion annually. 1 To contextualize this figure for the corporate balance sheet, it rivals the Gross Domestic Product of major G7 nations. This cost is not an abstract economic externality; it appears on the Profit and Loss (P&L) statements of individual companies, disguised as "maintenance," "customer support," "churn," and "emergency remediation."
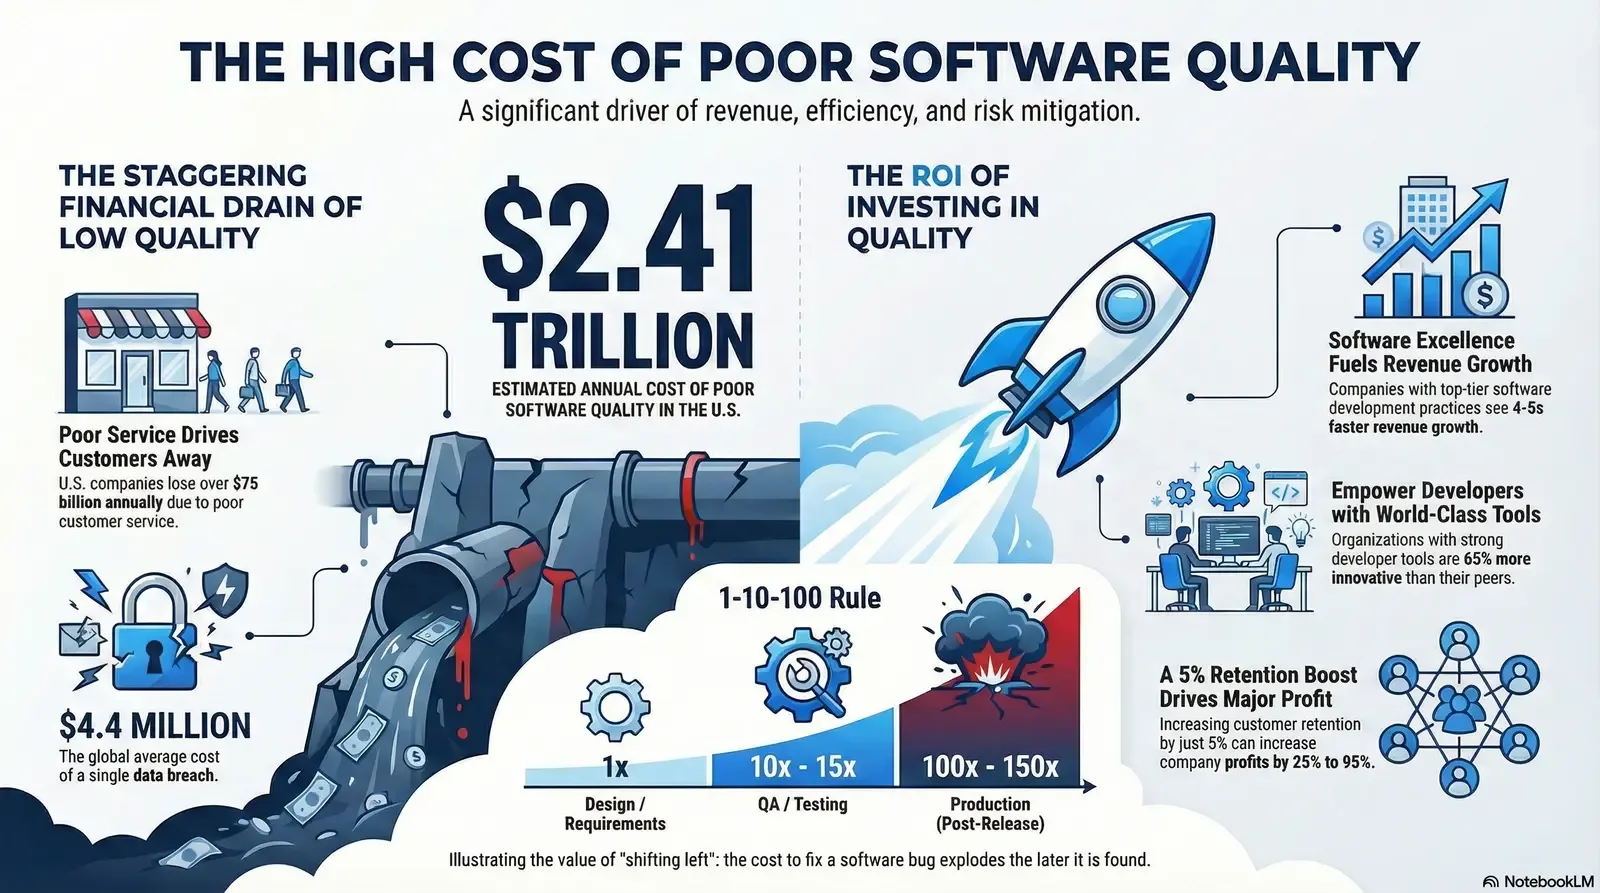
For the executive leadership of Baytech Consulting’s clients, the imperative is clear. The decision to invest in high-caliber, onshore, agile QA is not an engineering preference; it is a fiduciary responsibility. This report will dismantle the traditional cost-center view of QA, replacing it with a nuanced financial framework that quantifies the Return on Investment (ROI) of quality. We will explore the exponential cost curves of defect remediation, the direct correlation between software stability and Net Revenue Retention (NRR), and the defensive value of QA in an era where the average data breach costs nearly $5 million. 7
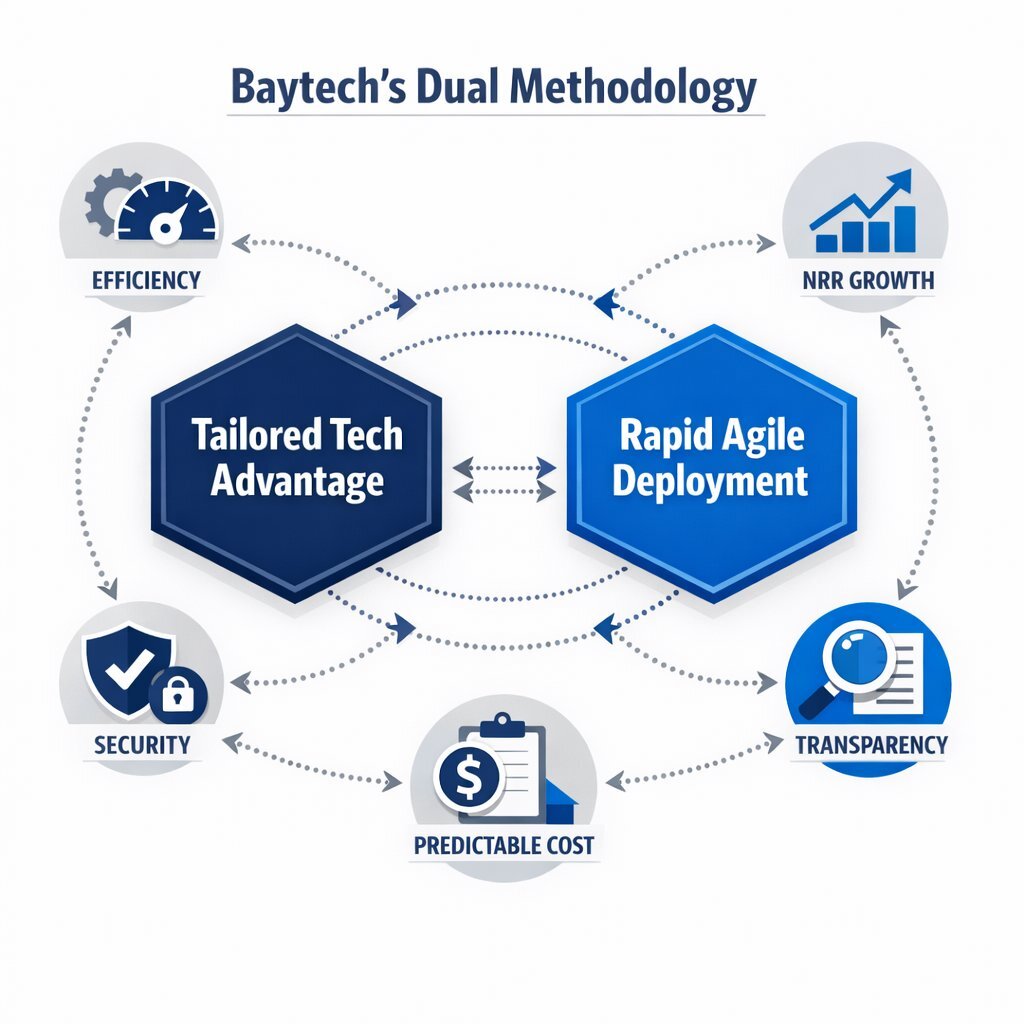
We will further demonstrate how Baytech Consulting’s proprietary frameworks— Tailored Tech Advantage and Rapid Agile Deployment —are specifically engineered to optimize this economic equation. By aligning engineering velocity with rigorous defect prevention, Baytech transforms the software development lifecycle (SDLC) from a source of unpredictable liability into a predictable asset generation engine.
2. The Ledger of Defects: Microeconomic Analysis of Quality Costs
To understand the macro-level impact of software quality on profitability, one must first dissect the microeconomics of the software defect. A "bug" is not merely a technical flaw; it is a unit of financial waste. The moment a defect is introduced into a codebase, it begins to accrue interest. The longer it remains undetected, the higher the compound interest rate it commands. This phenomenon creates a predictable, non-linear cost curve that serves as the foundational argument for early-stage QA intervention.
2.1 The Law of Exponential Cost Escalation (The 1-10-100 Rule)
Decades of software engineering research, anchored by data from the National Institute of Standards and Technology (NIST), IBM, and the seminal work of Capers Jones, have established a stable economic law: The cost to fix a defect rises exponentially relative to the phase of its detection.
This relationship, often summarized in executive briefings as the "1-10-100 Rule," illustrates the financial leverage of detection timing.
Table 1: The Defect Cost Multiplier and Financial Impact
| Development Phase | Detection Mechanism | Relative Cost to Fix | Financial Impact per Defect (Hypothetical) | Operational Implications |
|---|---|---|---|---|
| Requirements & Design | Architecture Review, Static Analysis | 1x | $100 | Minimal. A text edit in a specification document or a logic correction in a wireframe. Zero code impact. |
| Coding & Unit Test | Developer Self-Check, Pair Programming | 5x | $500 | Low. The developer catches the error in real-time. Context remains fresh; no context-switching penalty. |
| Integration & QA | Automated Regression, QA Specialist Review | 10x - 15x | $1,500 | Moderate. Requires ticket logging, reproduction steps, developer context switching, and re-testing cycles. |
| Beta / UAT | End-User Testing, Client Review | 50x | $5,000 | High. Deployment delays, friction with stakeholders, potential rollback of connected features, reputation risk. |
| Production (Post-Release) | Customer Report, System Crash | 100x - 150x | 10,000 - 15,000+ | Catastrophic. Emergency hotfixes, data corruption recovery, help desk surge, legal exposure, customer churn. |
Synthesis of Data:
The data indicates that a defect identified during the architectural design phase might cost $100 in engineering time to resolve. That identical logic error, if allowed to propagate through the build process and escape into the live production environment, will cost the organization upwards of $10,000 to remediate.6
This multiplier effect is driven by several compounding factors:
- Context Switching: When a developer fixes a bug immediately (1x cost), the mental model of the code is active in their working memory. Fixing a production bug (100x cost) requires the developer to stop current work, re-acquaint themselves with code written months ago, and trace complex dependencies, destroying productivity.
- The Blast Radius: A design flaw in the foundation affects every feature built upon it. Fixing the foundation after the house is built requires tearing down the house.
- Transactional Overhead: A production bug triggers a chain reaction of non-coding activities: customer support tickets, executive status meetings, root cause analysis reports, and public relations damage control.
Strategic Insight for the CFO:
If an organization spends $1 million on software development but neglects early-stage QA, relying instead on beta testing or user feedback to catch bugs, they are effectively choosing to pay premium prices for defect remediation. They are purchasing labor at 10,000 per unit (production fixes) rather than 100 per unit (design fixes).
Baytech Consulting’s refusal to use offshore resources is economically significant here. By utilizing high-skilled, onshore architects during the Requirements and Architect phases 12, Baytech ensures that the "1x" phase is handled by the most competent personnel. This "Shift Left" strategy is not merely a quality assurance tactic; it is a cost-avoidance strategy that prevents the accumulation of future liabilities.
2.2 The Hidden Tax of Rework
Beyond the cost of individual bugs lies the aggregate financial drain of "rework." In software economics, rework is defined as effort spent re-doing tasks that were already marked as complete.
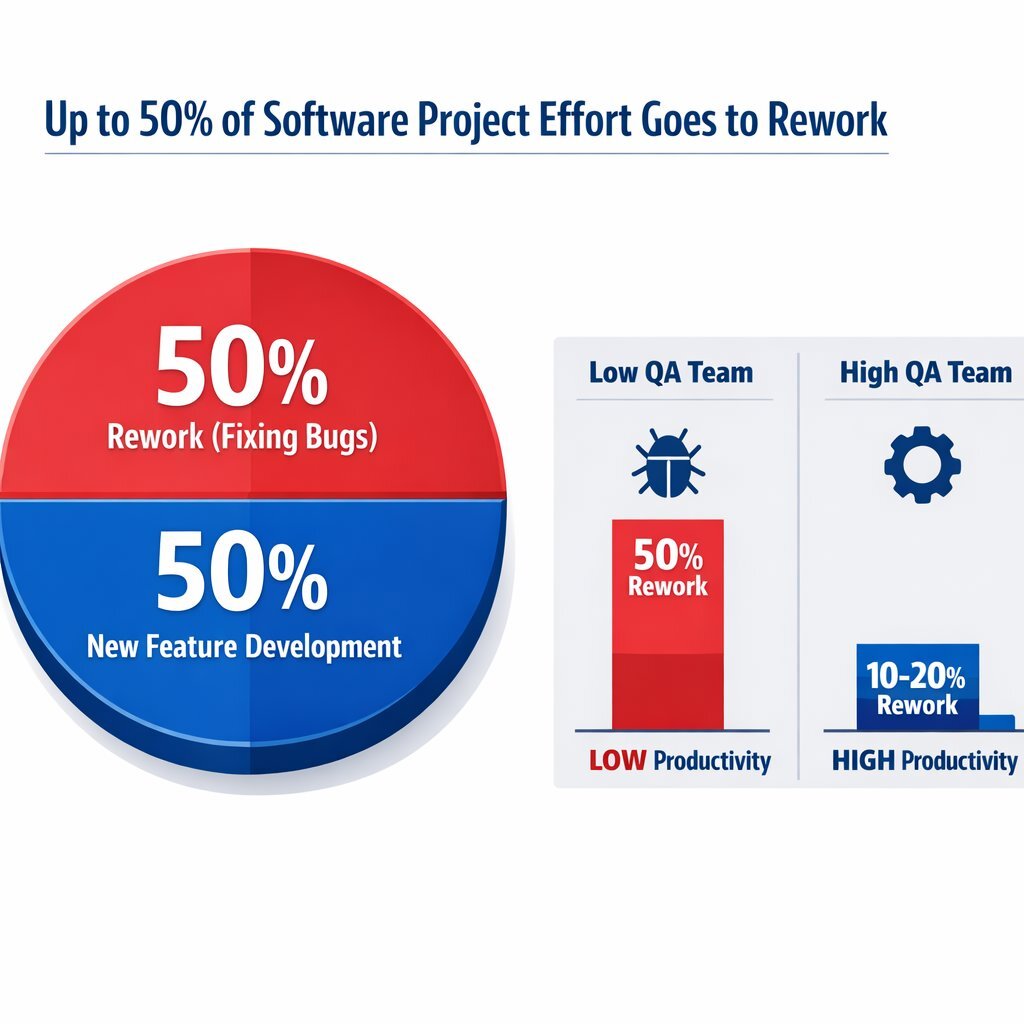
Capers Jones’ extensive analysis reveals a startling statistic for the average enterprise: Almost 50 cents out of every dollar spent on software projects goes to finding and fixing bugs. 6 In lower-maturity organizations, this figure can climb higher. This implies that half of the engineering payroll is not generating new assets or features; it is essentially managing waste.
The Baytech Efficiency Dividend:
For a VP of Engineering, this metric offers the most direct path to increasing effective capacity without increasing headcount.
- Current State (Low QA Maturity): A team of 20 developers delivers 10 units of value per sprint because 50% of their time is consumed by bug fixes and technical debt.
- Future State (High QA Maturity): By implementing Baytech’s Rapid Agile Deployment 14, which emphasizes continuous testing and "definition of done" rigor, the rework ratio drops to 10-20%.
- Result: The same team now delivers 16-18 units of value. This is a 60-80% increase in productivity achieved not by hiring, but by quality.
This efficiency gain is the "hidden profit" of QA. It manifests as faster time-to-market for revenue-generating features. McKinsey notes that businesses investing in digital transformation and software excellence can achieve 40% faster time-to-market. 15 In competitive markets, this speed is a determinant of market share.
3. The Growth Equation: Retention, Expansion, and the Quality Variable
While cost reduction provides a solid floor for the business case, the ceiling is defined by revenue growth. In the modern B2B landscape, particularly within the SaaS (Software as a Service) models that dominate Baytech’s client ecosystem, revenue is a function of retention.
3.1 The Churn-Quality Correlation
Customer acquisition is expensive. In B2B markets, the cost of acquiring a new customer (CAC) is typically 5 times higher than the cost of retaining an existing one. 17 Therefore, the financial health of a software-driven business is heavily dependent on minimizing churn.
The link between software quality and churn is direct and causal.
- The Tolerance Threshold: Users in 2024 have zero tolerance for friction. A study by Statista notes that more than a third of smartphone users delete an app immediately upon encountering a glitch. 18 In the B2B space, where workflows are critical, software instability translates directly to lost productivity for the client.
- The Involuntary Churn of Frustration: While some churn is "involuntary" (e.g., credit card failures), a significant portion of "voluntary" churn is driven by product dissatisfaction. "Poor product stability" and "bugs" are consistently cited as top reasons for non-renewal. 19
- The Compounding Loss: With median B2B SaaS churn rates hovering around 3.5% monthly 22, a company can lose nearly 35-40% of its customer base annually if it does not replenish the funnel. Reducing this churn rate by just 5% can increase overall profits by 25% to 95%. 17
Scenario Analysis:
Consider a B2B platform with $10 million in Annual Recurring Revenue (ARR).
- Scenario A (High Bug Rate): High frustration leads to 15% annual churn. Revenue erosion = $1.5 million.
- Scenario B (High Quality): Baytech’s QA stabilizes the platform, improving UX. Churn drops to 5%. Revenue erosion = $0.5 million.
- The Delta: $1 million in pure revenue preserved annually. This saving alone likely covers the entire cost of the QA engagement.
3.2 Net Revenue Retention (NRR) and the "Expansion" Imperative
For CFOs, Net Revenue Retention (NRR) is often the most critical metric for valuation. NRR measures the revenue retained from existing customers, plus expansion revenue (upsells/cross-sells), minus churn. An NRR above 100% indicates the business grows even without adding new logos.
Quality Assurance is the silent partner in Sales.
- Trust as a Currency: Upselling a client requires trust. A client will not upgrade to the "Enterprise Tier" if the "Standard Tier" crashes weekly. Stability is the prerequisite for expansion.
- Promoter Economics: High-quality software creates "Promoters" (NPS > 9). Promoters spend 67% more than new customers. 17
- Referenceability: In the custom software world, Baytech’s domain, a client’s willingness to serve as a reference is gold. Bugs destroy referenceability. QA protects it.
3.3 User Experience (UX) as a Financial Asset
User Experience is often discussed in aesthetic terms, but its financial impact is concrete. "Quality" includes usability, performance, and responsiveness.
- Efficiency for the User: If a B2B software is used by 1,000 employees at a client company, and a UI bug adds 10 seconds to a common workflow performed 10 times a day, the client loses substantial productivity. Eventually, the client’s CFO will notice the inefficiency and mandate a switch to a competitor.
- The "Amazon Effect": Consumer expectations have bled into B2B. Users expect the snappy, bug-free experience of Amazon or Google. When enterprise software feels "clunky" or "buggy" by comparison, adoption rates suffer.
- Baytech’s Tailored Approach: Baytech’s focus on Tailored Tech Advantage 23 ensures that the software is not just "bug-free" in a technical sense, but optimized for the specific workflow of the user, enhancing the "perceived quality" which drives retention.
4. The Risk Profile: Cybersecurity as a Financial Liability
In the current geopolitical and technological climate, software quality cannot be decoupled from security. A "vulnerability" is simply a bug with a security implication. For the CFO, this moves the conversation from "operational efficiency" to "existential risk mitigation."
4.1 The $4.88 Million Liability
The 2024 IBM Cost of a Data Breach Report provides the grim calculus of security failure.
- Global Average Cost: The average cost of a data breach has reached $4.88 million. 7
- US Premium: For US-based companies, this figure skyrockets to $9.88 million. 7
- Sector Specifics: In Healthcare, a key vertical for custom software, the average breach cost is nearly $10 million. 7
These costs are comprised of:
- Direct Technical Costs: Forensics, system restoration, patch deployment.
- Legal & Regulatory Costs: Fines for non-compliance (GDPR, CCPA) have increased by 22.7% in 2024. 7
- Lost Business: The largest component is often the loss of customers and reputation following the breach.
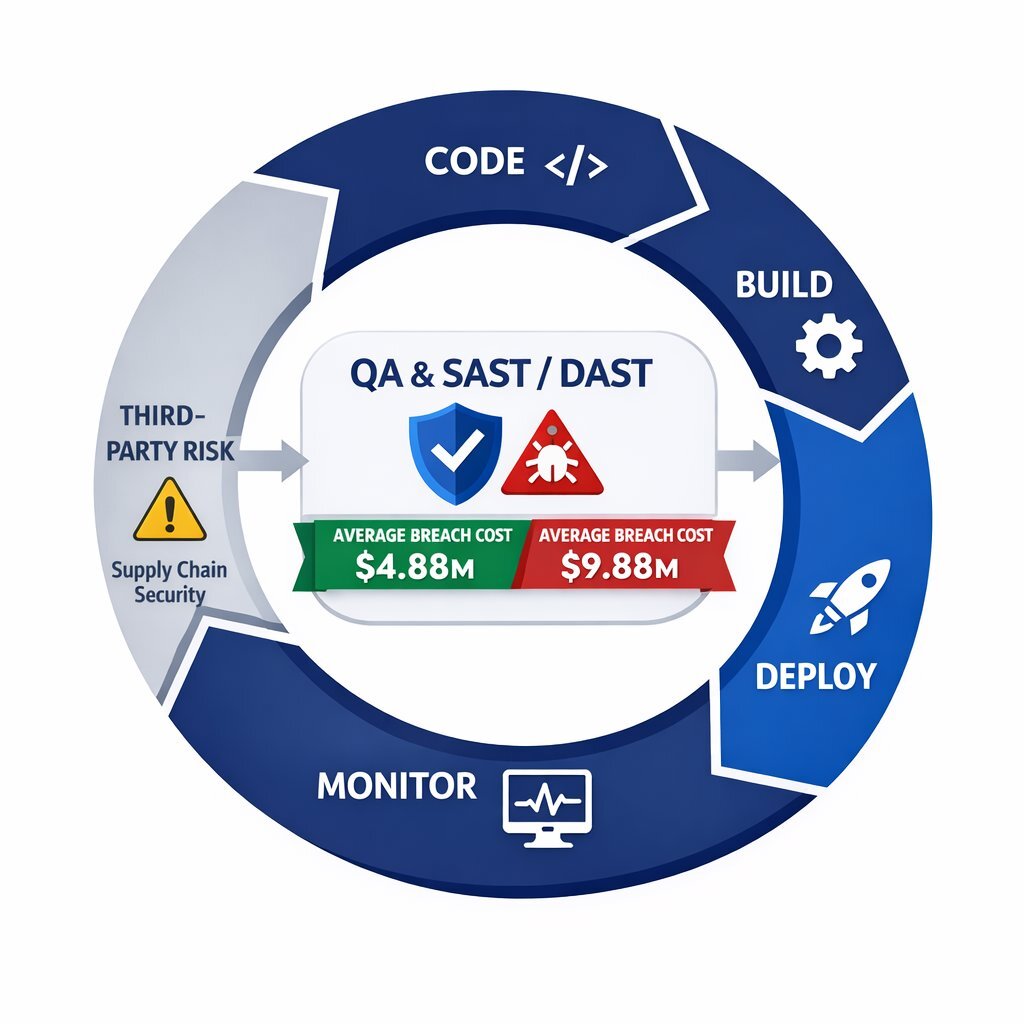
4.2 The Role of QA in Risk Mitigation (DevSecOps)
Traditional "penetration testing" once a year is no longer sufficient. Security must be integrated into the daily QA rhythm—a practice known as DevSecOps.
- Prevention vs. Cure: QA processes such as Static Application Security Testing (SAST) and Dynamic Application Security Testing (DAST) identify vulnerabilities like SQL Injection or Cross-Site Scripting (XSS) during the development phase.
- The Financial Delta: Finding a vulnerability in QA costs a few hundred dollars in developer time. Finding it after a breach costs $9.88 million. The ROI of preventing a single breach is essentially infinite relative to the cost of the QA tool.
- Supply Chain Risk: The SolarWinds attack 5 demonstrated that vulnerabilities can enter through third-party components. QA is responsible for auditing these dependencies. The cost of the SolarWinds hack averaged $12 million per affected company.
Baytech’s Defensive Posture:
Baytech’s commitment to onshore, in-house development significantly reduces the risk profile compared to models that rely on fragmented, global freelance networks where security protocols may be porous. By maintaining strict control over the development environment and integrating security testing into the Rapid Agile Deployment sprints 14, Baytech offers a "secure by design" product that lowers the client’s insurance premiums and liability exposure.
5. The Hidden Balance Sheet: Technical Debt and Asset Depreciation
"Technical Debt" is a metaphor that resonates with financial officers because it mimics financial debt instruments. It represents the implied cost of future work caused by choosing an easy solution now instead of a better approach that would take longer.
5.1 The Interest Rate of Bad Code
When a team skips QA to rush a feature out the door, they are effectively borrowing time.
- Principal: The refactoring and testing work that was skipped.
- Interest: The reduction in agility for every future sprint. Messy code is harder to read, harder to change, and more prone to regression.
- Compound Effect: As debt accumulates, the "interest payments" (time spent managing the mess) begin to consume 100% of the engineering capacity. Innovation grinds to a halt.
The $1.52 Trillion Anchor:
CISQ estimates that the accumulated software technical debt in the US is $1.52 trillion.2 This is capital that is locked up, unproductive, and dragging down corporate valuation.
5.2 Technical Debt as "Strategic Debt" vs. "Toxic Debt"
Not all debt is bad. A CFO might take on debt to finance expansion. Similarly, a VP of Engineering might incur "Strategic Technical Debt" to hit a critical market window, with a concrete plan to pay it down next quarter.
- Toxic Debt: However, debt incurred unintentionally due to lack of QA is "Toxic Debt." It is a high-interest payday loan taken out without the CFO’s knowledge.
- Asset Depreciation: Software is an asset. High technical debt accelerates the depreciation of that asset. A codebase riddled with bugs and spaghetti code has a lower useful life and may require a complete write-off (rewrite) much sooner than a well-maintained one.
Baytech’s Debt Management Strategy:
Baytech’s Rapid Agile Deployment 14 treats technical debt management as a line item in every sprint.
- Definition of Done: No feature is marked "Complete" until it passes QA. This prevents the accumulation of invisible debt.
- Refactoring: Sprints include capacity for refactoring, ensuring the principal is paid down regularly.
- Result: The asset maintains its value. The software remains malleable and responsive to business changes for years, maximizing the Return on Assets (ROA).
6. Operational Alpha: Velocity, Efficiency, and the Agile Paradox
There is a persistent myth in management circles that Quality Assurance slows down development. The logic seems sound: "If we stop to test, we are not coding." However, empirical data from the world’s highest-performing engineering organizations proves the exact opposite: Speed is a function of stability.
6.1 The Velocity-Quality Link
McKinsey & Company’s extensive study on "Developer Velocity" introduces the Developer Velocity Index (DVI). The findings are stark: Companies in the top quartile of DVI outperform others by 5x in revenue growth. 25
- The Mechanism: How do they move so fast? They invest in "Inner Loop" optimization. 26 The "Inner Loop" is the cycle of coding, building, and testing. By automating QA, these companies give developers immediate feedback.
- Confidence to Deploy: In low-QA environments, deployment is a terrifying event. It requires "code freezes," manual checklist reviews, and weekend war rooms. This fear acts as a brake on velocity. In high-QA environments (CI/CD), deployment is a non-event. It happens multiple times a day because the automated safety net (QA) provides the confidence to move fast.

6.2 Operational Efficiency and Context Switching
We previously discussed context switching in relation to bug costs. It also impacts general operational efficiency.
- Flow State: Developers are knowledge workers who require deep "flow" states to solve complex problems.
- The Interruption Tax: Every time a bug report comes in from production, that flow is broken. It can take 30 minutes to regain focus after a simple interruption.
- Aggregate Loss: If a team is constantly fighting fires (production bugs), their effective IQ drops. They become reactive rather than proactive.
Baytech’s Operational Model:
Baytech’s model maximizes "Flow." By ensuring requirements are clear (Tailored Tech Advantage) and testing is continuous (Rapid Agile), developers spend more time building value and less time fixing mistakes. This operational efficiency translates to lower Total Cost of Ownership (TCO) for the client. The client pays for features, not friction.
7. The Human Element: Talent, Culture, and Quality
The financial impact of QA extends to the Human Resources line item. In a tight labor market for top-tier engineering talent, the quality of the codebase is a primary retention tool for talent itself.
7.1 The Cost of Developer Burnout
Developers hate working on buggy, brittle code. It is demoralizing to spend weeks fixing regressions rather than building new features.
- Turnover Costs: High technical debt and low quality lead to developer burnout and turnover. Replacing a software engineer costs 150% to 200% of their annual salary in recruitment fees, onboarding time, and lost productivity.
- The "Bad Hire" Multiplier: Conversely, rushing to hire cheap talent to "fix" quality issues often backfires. A "bad hire" can cost 30% of their first-year salary and negatively impact the productivity of the surrounding team by 60%. 6

7.2 Quality as a Recruitment Asset
Baytech Consulting attracts top-tier, onshore talent because they maintain high standards of engineering excellence.
- The Virtuous Cycle: A clean codebase attracts great developers. Great developers write clean code.
- Client Benefit: The client benefits from this stability. They are not subjected to the knowledge loss associated with the constant churn of offshore "body shops." The team that builds the software stays to evolve it.
8. The Strategic Pivot: Baytech Consulting’s Methodology
Having established the universal financial imperatives of QA, we now examine how Baytech Consulting’s specific methodology operationalizes these principles to deliver superior profitability.
8.1 Tailored Tech Advantage: The Anti-Commodity
Baytech’s Tailored Tech Advantage 23 is a strategic response to the commoditization of software development.
- Customization vs. Configuration: Off-the-shelf software often requires businesses to change their processes to fit the tool. Baytech builds software that fits the business. This maximizes operational efficiency (OPEX savings) for the client.
- Human-in-the-Loop AI: Baytech leverages AI to accelerate development but creates a "trust paradox" where human oversight is more critical than ever. Baytech engineers act as the "expert filter," ensuring AI-generated code is secure, efficient, and free of hallucinations. This prevents the "AI Technical Debt" that is beginning to plague early adopters.
- Onshore Rigor: By refusing to offshore 12, Baytech ensures that communication—the primary source of requirements defects—is high-fidelity. This reduces the "Requirements Phase" defects which are the most expensive to fix if missed.
8.2 Rapid Agile Deployment: Financial Predictability
Baytech’s Rapid Agile Deployment 14 is designed to de-risk the investment profile of custom software.
- Fixed Time, Fixed Cost, Variable Scope: Traditional projects fix scope and let time/cost balloon. Baytech fixes the time (sprint) and cost (team run rate), allowing scope to be managed. This guarantees the project never goes "over budget" in the traditional sense; it only varies in the amount of value delivered per fixed investment unit.
- The Feedback Loop: Every two weeks, stakeholders see working software. This allows the CFO to "kill" or "pivot" a project early if the ROI isn't materializing, limiting value at risk to a single sprint rather than a multi-million dollar sunk cost.
- Transparency: This model provides the CFO with granular visibility into where capital is being deployed and what assets are being created in real-time.
9. Implementation Framework: A Guide for the CFO
To transition QA from a cost center to a profit driver, we recommend the CFO and VP of Engineering collaborate on the following strategic initiatives:
9.1 Restructure the Chart of Accounts for QA
- Action: Stop lumping QA tools and personnel into "General Administrative" or "Overhead."
- Strategy: Allocate QA spend to "Asset Protection" or "R&D Efficiency." Recognize that a dollar spent on QA releases two dollars of developer capacity.
9.2 Implement "Defect Removal Efficiency" (DRE) Metrics
- Action: Move away from "Cost per Defect" (which encourages under-reporting).
- Metric: Adopt Defect Removal Efficiency (DRE) —the percentage of bugs found before release vs. after release.
- Target: World-class organizations achieve >95% DRE. 9 Incentivize the Baytech team and internal stakeholders on this metric.
9.3 Mandate "Shift Left" in Vendor Contracts
- Action: When reviewing proposals, look for heavy allocation of senior resources in the Architecture/Design phase.
- Red Flag: Be wary of vendors who propose "light" design phases and massive testing phases. This is the "inspecting quality in" approach, which is expensive.
- Baytech Alignment: Validate that Baytech’s engagement model front-loads the intellectual labor to minimize downstream rework.
9.4 The Technical Debt Audit
- Action: Commission an annual "Technical Debt Audit" alongside the financial audit.
- Goal: Quantify the liability. If the codebase requires $500k of refactoring to remain secure, that is a liability that should be understood by the Board.
Conclusion
The mathematical reality of software economics allows for only one conclusion: Quality is free. It is the lack of quality that is expensive.
For the modern enterprise, the "Cost of Quality" is actually a negative number—it is a source of savings. By investing in rigorous QA, specifically the high-touch, agile, onshore model provided by Baytech Consulting, organizations do not just "fix bugs." They:
- Stop leaking capital through the 100x cost multiplier of late-stage defects.
- Protect revenue by reducing churn and enabling NRR expansion.
- Insulate the balance sheet from the multi-million dollar shocks of cyber-liability.
- Accelerate velocity, capturing market share from slower, bug-burdened competitors.
For the CFO and VP of Engineering, the partnership with Baytech Consulting is not merely a purchase of coding hours. It is a strategic investment in a high-yield asset class—resilient, scalable, and profitable software. The business case is closed: Quality is the most profitable feature you can build.
Supporting Articles
- The Cost of Poor Software Quality in the US: A 2022 Report – https://www.it-cisq.org/the-cost-of-poor-quality-software-in-the-us-a-2022-report/
- Cost of a Data Breach Report 2024 – https://www.ibm.com/reports/data-breach
- Developer Velocity: How software excellence fuels business performance – https://www.mckinsey.com/industries/technology-media-and-telecommunications/our-insights/developer-velocity-how-software-excellence-fuels-business-performance
- 14 Surprising Customer Retention Statistics for 2024 – https://www.industryselect.com/blog/14-surprising-customer-retention-statistics
About Baytech
At Baytech Consulting, we specialize in guiding businesses through this process, helping you build scalable, efficient, and high-performing software that evolves with your needs. Our MVP first approach helps our clients minimize upfront costs and maximize ROI. Ready to take the next step in your software development journey? Contact us today to learn how we can help you achieve your goals with a phased development approach.
About the Author

Bryan Reynolds is an accomplished technology executive with more than 25 years of experience leading innovation in the software industry. As the CEO and founder of Baytech Consulting, he has built a reputation for delivering custom software solutions that help businesses streamline operations, enhance customer experiences, and drive growth.
Bryan’s expertise spans custom software development, cloud infrastructure, artificial intelligence, and strategic business consulting, making him a trusted advisor and thought leader across a wide range of industries.