
In this article
- Where the Three Weeks Go
- Four Systems, Four Definitions, One Number
- What Restricted Funds Add to the Problem
- Why There Is No Single Report
- Phase One: The Reconciled Data Layer in Nonprofit Custom Software Development
- Paying for Infrastructure with Restricted Money
- Integration Realities Across the Common Nonprofit Stack
- Governing Outcome Definitions
- When to Migrate Instead
- Conclusion
- Supporting Links
- About Baytech
- About the Author
A development director can easily report the exact number of hours the last funder report consumed. What development teams rarely admit is that the exact same numbers were assembled three other times during the same quarter, slightly differently, for three different audiences.
Nonprofit technology conversations heavily favor donor CRM selections and grant-discovery tools—applications designed to secure funding. The reporting obligations attached to those funds receive far less attention, despite consuming comparable staff hours. Grant reporting operates fundamentally as a data integration problem. The necessary figures exist, but they reside in incompatible systems with conflicting definitions. Buying a better dashboard overlay does not reduce the manual work. Instead, utilizing nonprofit custom software development to build a modest reporting layer delivers a far better return on investment than migrating to an entirely new, massive platform.
Where the Three Weeks Go
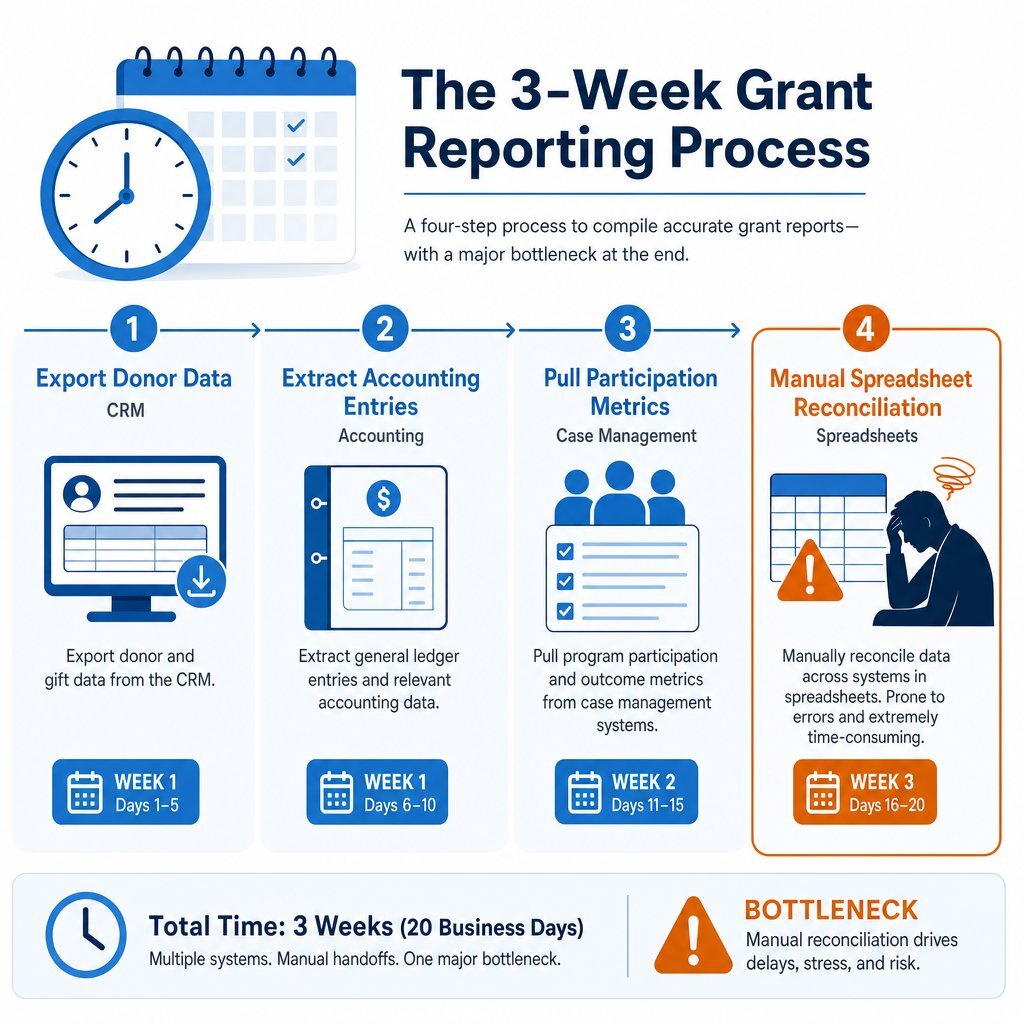
At grant-funded organizations, the quarterly reporting cycle forces highly skilled program managers into the role of manual data clerks. The process requires exporting comma-separated values (CSVs) from a donor database, extracting ledger entries from the accounting system, and pulling participation metrics from one or two case management tools. Staff then reconcile these files by hand in a spreadsheet to match a format specified by a particular funder.
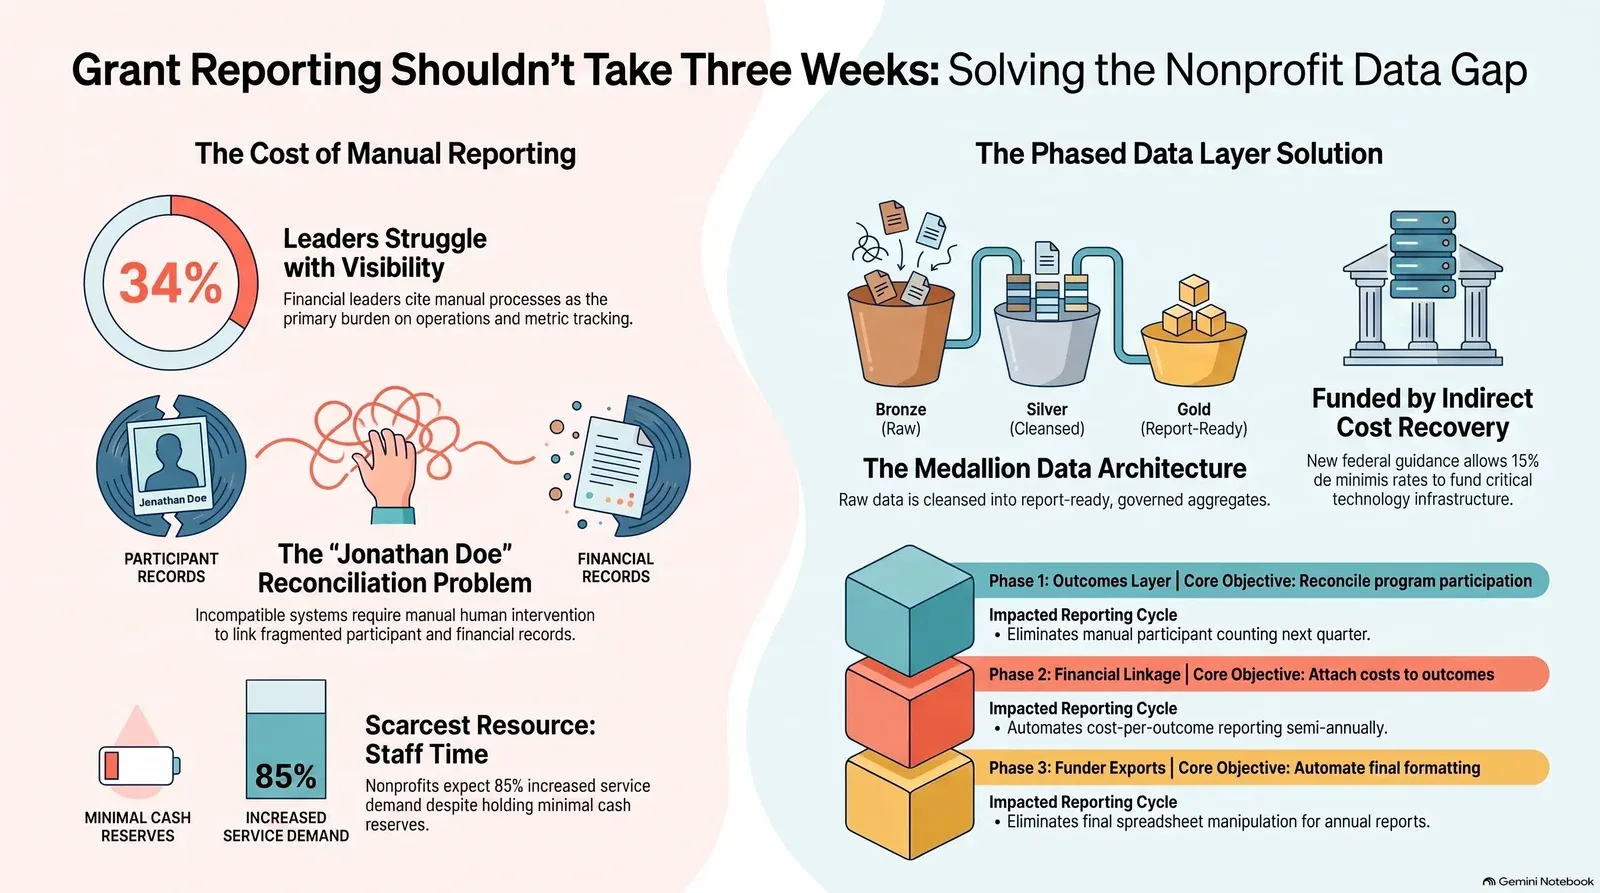
The Nonprofit Finance Fund reports that 36% of organizations ended 2024 with an operating deficit, and 85% expect service demand to increase. With over half of respondents holding three months or less of cash on hand, staff time remains the sector's absolute scarcest resource. Despite this scarcity, 34% of nonprofit financial leaders struggle with a lack of visibility into key metrics, citing manual processes as a primary burden on operations.
The hours vanish into cross-referencing records. Because John Doe exists as "Jonathan Doe" in the program system and "J. Doe" in the accounting software, human intervention becomes the only way to prove he received services funded by a specific grant. This data duplication and fragmentation render automated reporting impossible without a centralized architecture.
| Process State | Characteristics | Primary Bottlenecks |
|---|---|---|
| Current Manual State | Fragmented data extracts; hand-keyed spreadsheet mapping; siloed verification. | High labor cost; human error; breaks instantly when a funder changes a required format. |
| Target Data Layer State | Automated API ingestion; unified identifier mapping; programmatic report generation. | Requires initial engineering investment; relies on stable vendor APIs and clean source data. |
Four Systems, Four Definitions, One Number
The disconnect stems from the distinct, specialized tools organizations rely on to function. Each system treats a "constituent" or a "dollar" through a fundamentally different technical lens.
| System Type | Common Examples | What It Holds | Integration Options | Known Limitations |
|---|---|---|---|---|
| Donor CRM | Raiser's Edge NXT, Bloomerang | Donor records, gift transactions, pledge schedules | REST APIs, Webhooks | Optimized for inbound revenue; poor at tracking granular program outcomes. |
| Fund Accounting | Financial Edge NXT, QuickBooks | Chart of accounts, restricted fund balances, payroll | Native ERP integrations, APIs | Tracks dollars, not humans; cannot natively map spending to social outcomes. |
| Case Management | Casebook, Apricot | Participant demographics, program delivery metrics | Standard REST APIs | Highly siloed; data models rarely map easily to financial general ledgers. |
| Spreadsheets | Microsoft Excel, Google Sheets | The manual bridge reconciling the above three systems | CSV imports/exports | Zero governance; error-prone; breaks instantly upon logic or format changes. |
A program manager asked to provide a cost-per-successful-youth-placement metric must extract the numerator (dollars spent) from the accounting software and the denominator (youths placed) from the case management tool. Because the two systems share no common database key, the reconciliation defaults to manual spreadsheet labor.
What Restricted Funds Add to the Problem
General commercial accounting tracks revenue and expenses to determine profitability. Nonprofit accounting faces a distinct structural hurdle: tracking donor intent. Under FASB ASC 958, organizations must classify net assets strictly as either "with donor restrictions" or "without donor restrictions."
A restricted dollar carries binding legal constraints regarding how and when it can be deployed. These restrictions demand that every expense charged against a specific grant traces directly back to the funder's original stipulations. General business software fails here because a commercial system assumes a dollar earned is a dollar available for any operational need.
In a grant-funded nonprofit, the data model must maintain a rigid, many-to-many relationship between the source of the funds (the restricted grant) and the destination of the funds (the program outcome). Few off-the-shelf software tools successfully represent both financial restrictions and programmatic outcomes in a single unified interface.
Why There Is No Single Report
Because each foundation, government agency, and major donor specifies their own required format, reporting period, and outcome definitions, a single canonical report proves impossible. Funder A might require a quarterly breakdown of "youths served" aged 12–18. Funder B might require a semi-annual breakdown of "participants" aged 10–16.
Purchasing a sophisticated business intelligence dashboard tool to sit on top of unreconciled databases fails to address this reality. A dashboard cannot invent mapping logic that does not exist.
The structural solution requires a common data layer. Adopting a medallion data architecture—often used in enterprise engineering—solves the fragmentation. Bronze-level storage ingests raw data automatically from the CRM, accounting, and case management APIs. Silver-level processing cleanses and deduplicates the data, ensuring that "Jonathan Doe" and "J. Doe" merge into a single entity. Gold-level tables provide business-ready aggregates mapping restricted dollars to governed program metrics. With this architecture in place, organizations generate any required funder format dynamically. The goal shifts from building a single report to building a reliable data repository capable of feeding infinite report formats.
Phase One: The Reconciled Data Layer in Nonprofit Custom Software Development
Attempting to build a comprehensive data warehouse covering every metric in the organization guarantees a stalled project. Scope discipline dictates a highly targeted first phase. Utilizing Rapid Agile Deployment methodologies, teams should sequence the work to deliver value within a single reporting cycle.
| Delivery Phase | Core Objective | Shipped Functionality | Impacted Reporting Cycle |
|---|---|---|---|
| Phase 1: Outcomes Layer | Reconcile program participation | API extraction from case management; central PostgreSQL constituent mapping table. | Next immediate quarter. Eliminates manual participant counting. |
| Phase 2: Financial Linkage | Attach costs to outcomes | API ingestion of restricted fund ledger balances; mapping costs to program ID keys. | Semi-annual cycle. Automates cost-per-outcome reporting. |
| Phase 3: Funder Exports | Automate final formatting | Dynamic query generation outputting to funder-specific CSV or API formats. | Annual cycle. Eliminates the final spreadsheet manipulation. |
The highest-return initial build focuses strictly on reconciling program participation and outcomes data. These are the metrics funders request most frequently and the data points most violently scattered across disparate tools. By extracting participation data via API and modeling it into a single, clean database table, an organization immediately eliminates the manual cross-referencing step. This provides immediate operational relief to program managers and secures executive buy-in for subsequent phases.
Paying for Infrastructure with Restricted Money
The primary barrier to deploying custom data architecture in the nonprofit sector is the restriction on how funds are spent. The Stanford Social Innovation Review famously codified this as the "Nonprofit Starvation Cycle." Funders historically harbor unrealistic expectations about overhead costs, forcing nonprofits to underinvest in the critical technical infrastructure required to run a modern organization.
Federal grant mechanisms offer a distinct path to funding infrastructure. The 2024 revision to the federal Uniform Guidance increased the guaranteed de minimis indirect cost rate from 10% to 15% of Modified Total Direct Costs (MTDC). The formula dictates:
This regulatory shift allows nonprofits lacking a Negotiated Indirect Cost Rate Agreement (NICRA) to automatically allocate 15% of eligible direct grant costs toward overhead—which directly funds technology, data layers, and administrative efficiency.
Organizations must navigate exceptions carefully. The National Institutes of Health (NIH) abruptly reverted to the legacy 10% de minimis rate in April 2026 due to statutory mandates embedded in the Consolidated Appropriations Act. Despite such agency-specific rollbacks, the broader strategic shift remains clear: recovering allowable indirect costs provides the exact capital required to fund a phased, custom data layer.
Integration Realities Across the Common Nonprofit Stack
A common data layer requires continuous data extraction, which immediately confronts the API limitations of the underlying vendor stack. Building a custom application requires engineering around these strict vendor guardrails. Deploying solutions via Azure DevOps On-Prem or standard cloud environments requires specific caching and polling logic, much like any disciplined DevOps integration effort.
The Blackbaud SKY API, powering tools like Raiser's Edge NXT and Financial Edge NXT, enforces strict rate limits to preserve system stability. Standard subscriptions encounter a quota limit of 25,000 calls per 24 hours and a hard throttle of 10 calls per second. A poorly optimized integration script querying individual donor records sequentially will exhaust this daily quota within hours. Engineers must design data layers utilizing batch endpoints and delta loads—querying only for records flagged with a last_modified timestamp since the previous sync.
Similarly, Bloomerang's REST API offers extensive capabilities for managing constituents and transactions but demands strict server-side credential management. Casebook and similar case management APIs allow pagination and attribute filtering, which reduces data overhead during transit. Designing the custom software to poll these systems efficiently, handle HTTP 429 (Too Many Requests) errors gracefully with exponential backoff, and cache results locally in a PostgreSQL database is what separates a successful reporting layer from a brittle, failing script.
Governing Outcome Definitions
Technology only accelerates the rules it is given. If an organization lacks internal consensus on what constitutes a successful program outcome, the reporting software will accurately report conflicting data.
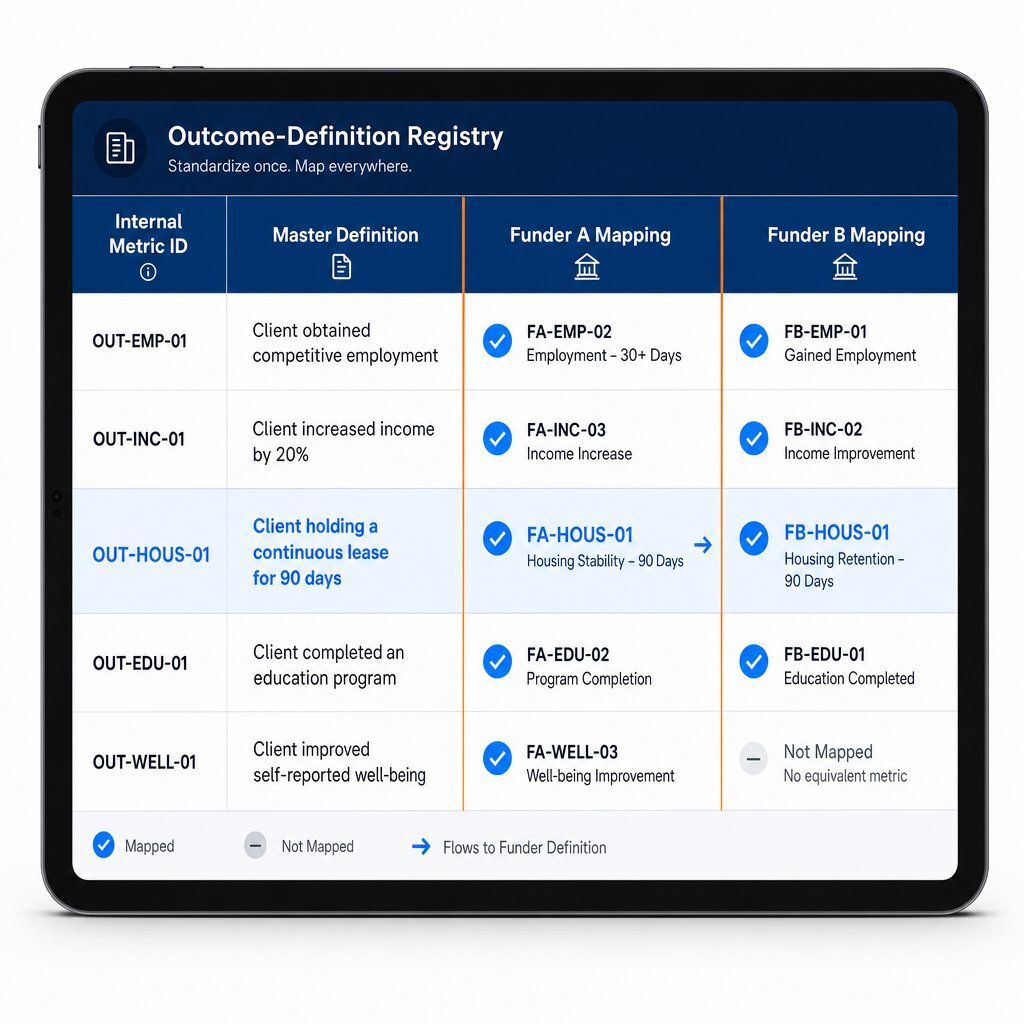
A central component of a custom reporting layer is an outcome-definition registry. This logical governance framework defines exactly what a metric means.
| Internal Metric ID | Master Definition | Funder A Output Mapping | Funder B Output Mapping |
|---|---|---|---|
OUT-HOUS-01 | Client holding a continuous lease for 90 days | "Housing Placements" (Count) | "Long-Term Stability" (Percentage) |
OUT-YTH-05 | Participant attending 80%+ of scheduled sessions | "Active Youth" (Age 12–18 filter) | "Engaged Students" (No age filter) |
OUT-EMP-02 | Client securing employment above minimum wage | "Job Placements" (Wage specified) | "Economic Independence" (Binary Y/N) |
If a housing nonprofit defines "permanently housed" as a client holding a lease for 90 consecutive days, the data layer codifies this rule. When Funder A asks for "housing placements" and Funder B asks for "long-term stability," the system maps both requests back to the single, governed definition in the registry. This governance ensures that the same metric means the same thing across different funders and across multiple fiscal years, preserving institutional memory even when staff turnover occurs.
When to Migrate Instead
A custom data layer acts as an integration hub, but it cannot resurrect a fundamentally broken source system. Organizations must recognize when a platform migration outweighs the benefits of an integration layer.
If an organization runs the legacy Salesforce Nonprofit Success Pack (NPSP) and suffers from severe architectural debt, building an integration layer on top of it simply perpetuates the debt. Salesforce has actively shifted innovation toward its new Nonprofit Cloud. The new architecture abandons NPSP's custom Household objects in favor of standard Person Accounts and introduces an integrated Outcomes Management module built directly into the core platform.
If the core CRM requires this magnitude of structural replacement, migrating to a modern platform serves the organization better than attempting to extract data from a dying architecture. However, if the source systems are healthy but simply disconnected, a reporting data layer remains the most cost-effective and least disruptive path to automation. In those cases, a phased legacy modernization roadmap will usually outperform a risky big-bang rewrite.
Conclusion
Grant reporting consumes an unacceptable share of nonprofit administrative capacity because the industry treats data integration as a manual clerical task rather than an engineering problem. Restricted funding constraints and disparate software platforms guarantee that no single, out-of-the-box system will satisfy every funder's reporting format.
By building a disciplined, custom data layer that centralizes program outcomes and financial restrictions, organizations replace three weeks of spreadsheet reconciliation with automated, reproducible reports. Establishing a governed source of truth protects data integrity, honors donor restrictions, and frees program managers to execute their actual missions.
Baytech Consulting specializes in custom software development and application management. Utilizing our Tailored Tech Advantage and rigorous discovery and scoping practices, organizations can build these critical integration layers securely, on time, and without enduring a catastrophic full-system replacement. Contact us to scope the first phase of your data reporting layer and choose the right engagement model and contract structure for your nonprofit.
FAQ
Can we just deploy a dashboard tool like Power BI or Tableau to fix our reporting?
Dashboards visualize data; they do not reconcile it. If the underlying data resides in siloed systems with conflicting definitions, connecting a dashboard directly to those systems will only visualize the discrepancies faster. A unified data layer must be built first to clean, map, and govern the data before a business intelligence tool can report on it accurately. For many teams, that starts with a clear UX-led discovery process so the right metrics and workflows are designed up front.
Supporting Links
- How to Implement a Phased Approach to Software Development
- The Ultimate Build vs Buy Software Guide
Why the Discovery Phase in Software Development is Crucial for ROI
About Baytech
At Baytech Consulting, we specialize in guiding businesses through this process, helping you build scalable, efficient, and high-performing software that evolves with your needs. Our MVP first approach helps our clients minimize upfront costs and maximize ROI. Ready to take the next step in your software development journey? Contact us today to learn how we can help you achieve your goals with a phased development approach.
About the Author

Bryan Reynolds is an accomplished technology executive with more than 25 years of experience leading innovation in the software industry. As the CEO and founder of Baytech Consulting, he has built a reputation for delivering custom software solutions that help businesses streamline operations, enhance customer experiences, and drive growth.
Bryan’s expertise spans custom software development, cloud infrastructure, artificial intelligence, and strategic business consulting, making him a trusted advisor and thought leader across a wide range of industries.