
Cut Your Release Cycle by 45%: The Real Business ROI of Azure DevOps
October 06, 2025 / Bryan Reynolds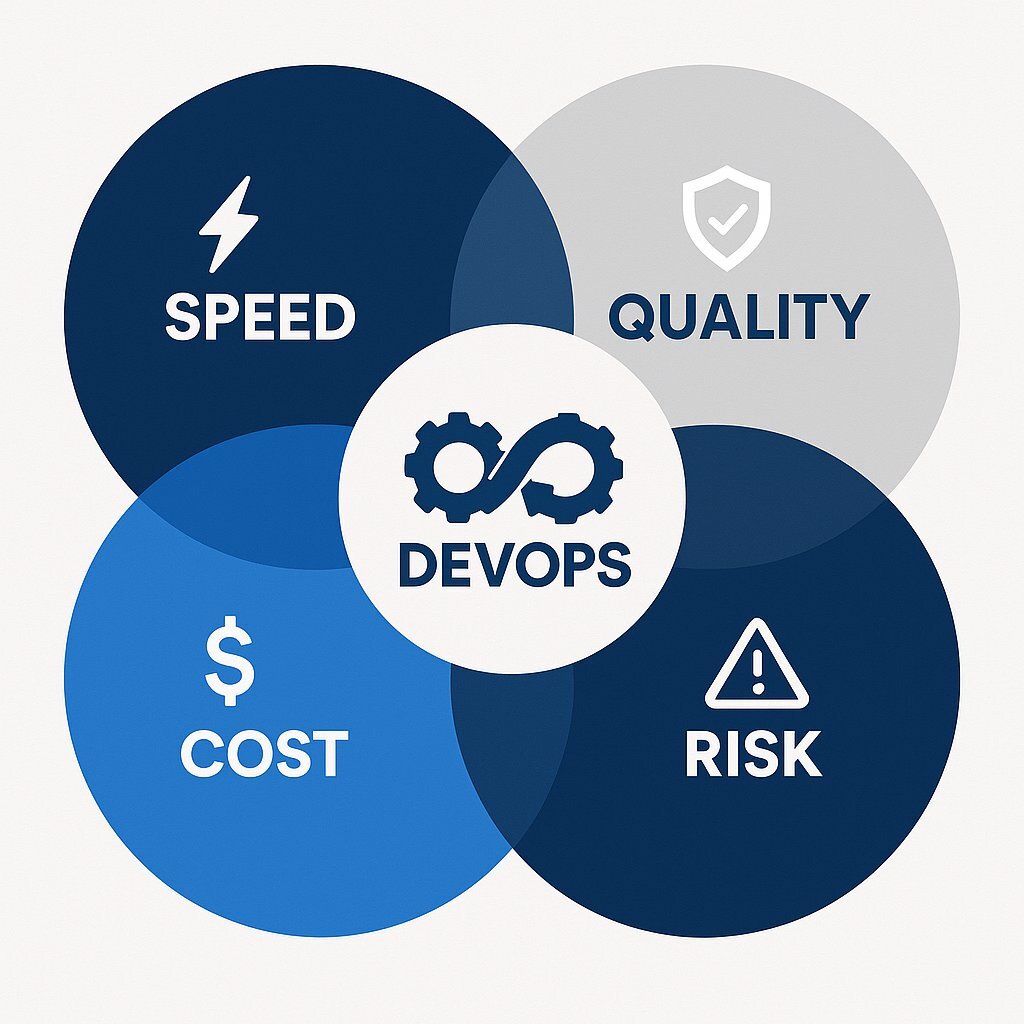
The ROI of DevOps: How Azure DevOps Can Cut Your Release Cycle by 45%
Are You Asking the Right Questions About Your Technology Spend?
For today’s executive leadership, the conversation around technology investment has fundamentally shifted. The traditional view of IT as a "cost center" is obsolete. In its place is a new mandate: engineering must be a primary "value driver" for the business. For Vice Presidents of Engineering, Chief Information Officers, and Chief Financial Officers, the pressure is to innovate faster, maintain impeccable stability, and demonstrate a clear financial return on every dollar spent.
This creates a perceived tension between competing priorities: speed, quality, cost, and risk. DevOps, however, is not merely a technical methodology; it is a business strategy designed to resolve these tensions. This article, following the ‘They Ask You Answer’ approach, directly addresses the most pressing questions executives have when considering a DevOps transformation:
- What is the real, quantifiable Return on Investment (ROI) of DevOps for my business?
- How, specifically, does a platform like Azure DevOps deliver these results?
- Where is the proof that other companies have achieved this?
- What is the first step my organization can take to calculate our potential ROI?
The central claim is this: a strategic investment in Azure DevOps can cut your software release cycle by 45%. This assertion is not speculative; it is substantiated by a detailed, real-world case study of a financial services firm that achieved this and more, transforming its technology division from a bottleneck into a competitive advantage.
What is the 'Real' ROI of DevOps for My Business?
The ROI of DevOps is not an abstract technical concept; it is a set of measurable business outcomes that directly impact your profit and loss statement. To understand it, leadership must move beyond developer-centric metrics and adopt a framework that speaks the language of the boardroom. Calculating DevOps ROI requires a comprehensive look at both cost-driven and value-driven metrics. This includes direct costs like tools and training, but more importantly, it focuses on the net benefits generated through gains in efficiency, quality, and time-to-market. The ultimate goal is to connect technical process improvements to tangible business results.
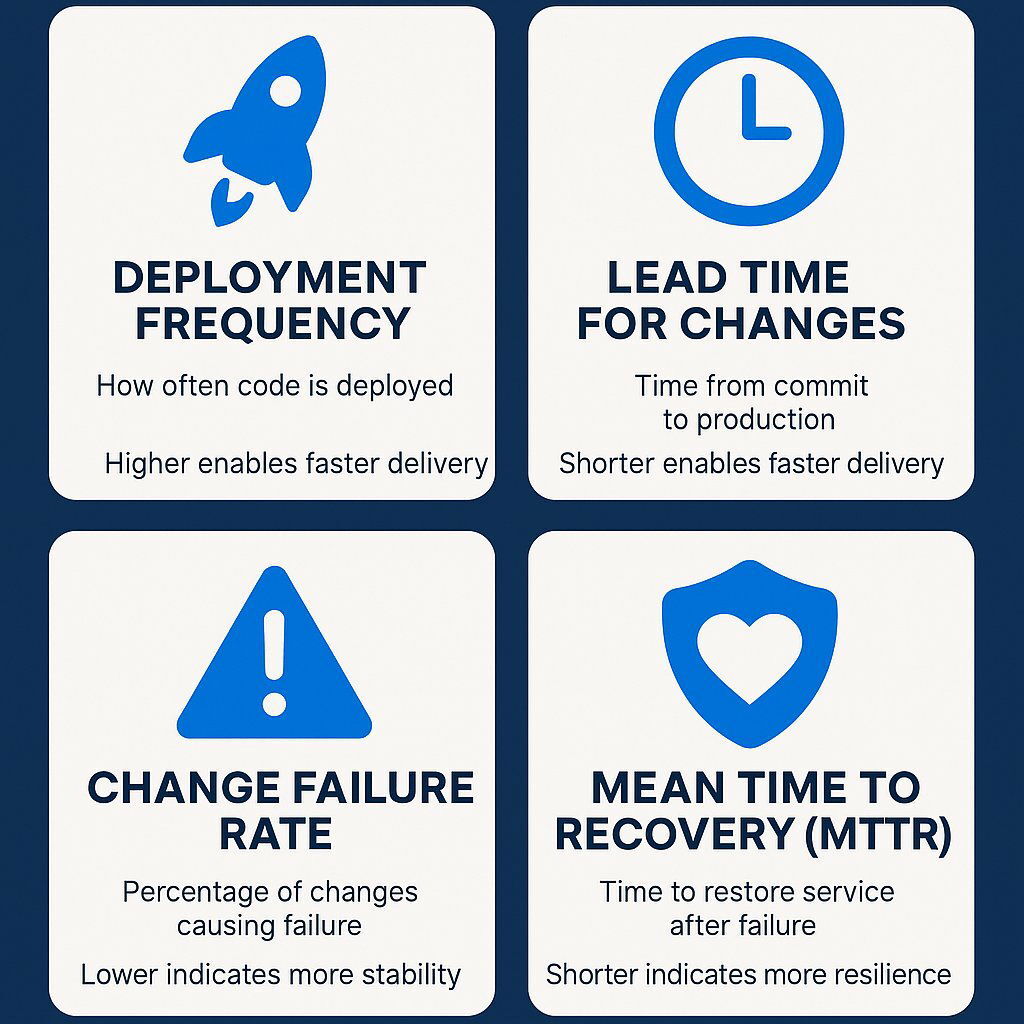
To achieve this, the industry has standardized on a set of key performance indicators developed by Google's DevOps Research and Assessment (DORA) team. These four DORA metrics serve as a C-suite dashboard, offering a clear view of the health and performance of a company's innovation engine. They are divided into two categories: speed and stability.
Speed Metrics:
- Deployment Frequency: This measures how often an organization successfully releases code to production. It is a direct indicator of market responsiveness and the ability to deliver value to customers quickly.
- Lead Time for Changes: This tracks the time it takes from a code commit to that code successfully running in production. It is a crucial measure of organizational agility and the efficiency of the entire delivery pipeline.
Stability Metrics:
- Change Failure Rate (CFR): This is the percentage of deployments to production that result in a failure requiring remediation, such as a hotfix or a rollback. It is a measure of quality and its direct impact on customer trust and rework costs.
- Mean Time to Recovery (MTTR): This measures the average time it takes to restore service after a production failure. It is a critical indicator of business resilience and the ability to minimize the impact of downtime.
Improvements in these four areas have a direct and quantifiable impact on financial performance. Higher Deployment Frequency and lower Lead Time for Changes correlate directly to a faster time-to-market, which accelerates revenue generation from new features. A lower Change Failure Rate significantly reduces the cost of rework; studies show that the cost of fixing a bug found in production is up to 100 times higher than fixing it during the design phase. Finally, a lower MTTR minimizes the cost of downtime, protecting critical revenue streams and brand reputation. For a deeper analytical approach, Google Cloud's whitepaper on the ( https://cloud.google.com/resources/roi-of-devops-transformation-whitepaper ) provides a data-driven framework for justifying these investments.
Crucially, these metrics are not independent; they exist in a virtuous cycle. Elite-performing organizations, which deploy frequently in small batches, also experience lower change failure rates and faster recovery times. This occurs because frequent deployments necessitate smaller, more manageable changes. These smaller batches are inherently less risky and far easier to diagnose if they cause a failure, which directly lowers the Change Failure Rate. Because the deployment process is highly automated and practiced, fixing the issue or rolling back the small change is significantly faster, thus lowering MTTR. For a CFO, this reveals a powerful connection: an investment in speed is simultaneously an investment in risk reduction and operational stability.
To bridge the gap between the engineering team and the executive suite, it is essential to translate these metrics into clear business terms.
| DevOps Metric (DORA) | What It Really Measures (Business Term) | Why It Matters to Your Bottom Line |
|---|---|---|
| Deployment Frequency | Rate of Value Delivery | Measures how quickly you can respond to market changes and customer feedback. Higher frequency = faster innovation cycles. |
| Lead Time for Changes | Time from Idea to Revenue | The total time it takes to implement, test, and deliver a new feature. Shorter lead time = faster time-to-market. |
| Change Failure Rate | Cost of Poor Quality | The percentage of changes that result in service degradation or require remediation. Lower rate = reduced rework costs, higher customer trust. |
| Mean Time to Recovery (MTTR) | Business Resilience | The time it takes to recover from a production failure. Lower MTTR = minimized downtime, protected revenue, and brand reputation. |
How Exactly Does Azure DevOps Deliver These Results?
Achieving elite DORA metrics is not about forcing teams to work harder; it is about empowering them with an integrated platform that automates processes, enhances visibility, and aligns daily work with strategic business goals. Azure DevOps is a comprehensive suite of services designed to provide this empowerment, creating a system where speed and stability are natural outcomes of an optimized process.
Automating the Engine Room with Azure Pipelines (CI/CD)
The primary cause of long lead times and high change failure rates is often a reliance on slow, manual, and error-prone release processes. Azure Pipelines directly addresses this challenge by automating the entire software delivery lifecycle—from code commit to production deployment.
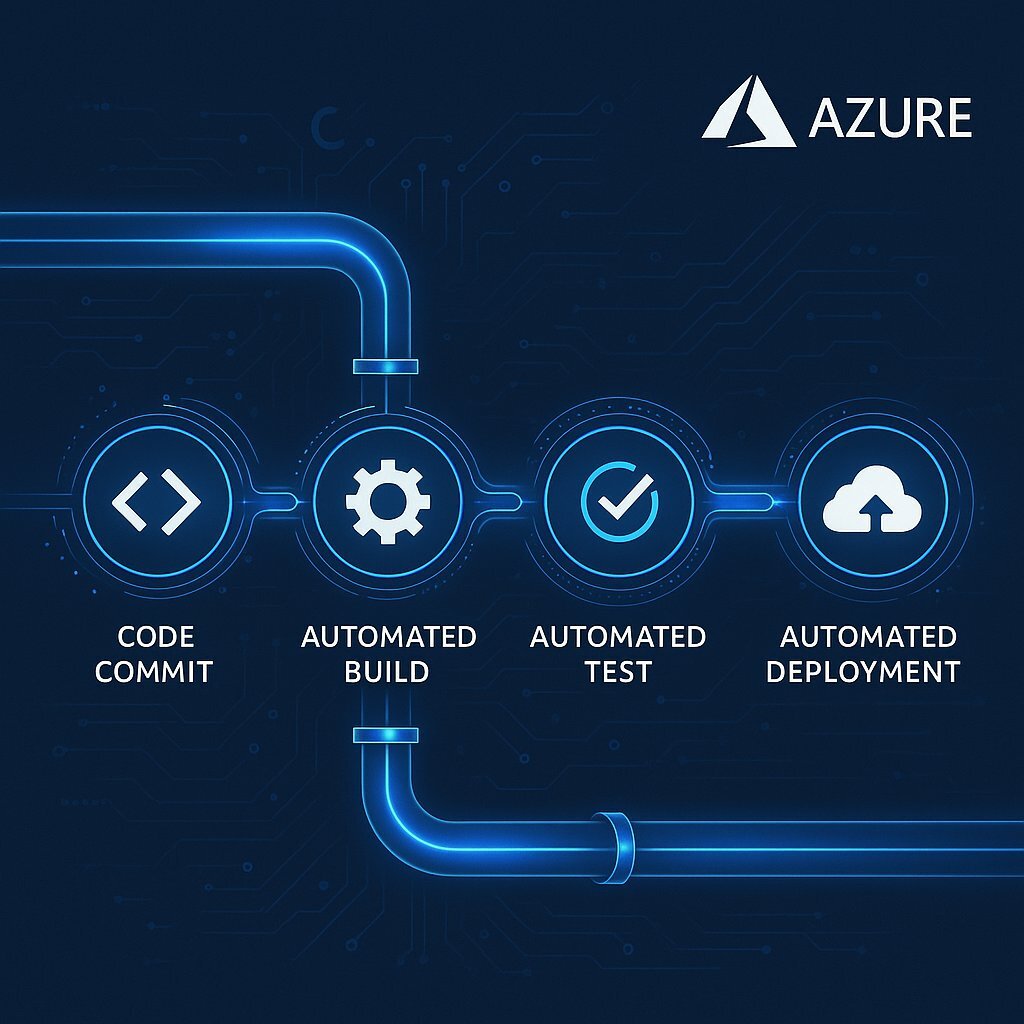
Azure Pipelines drives performance by automating builds, testing, and deployments, which eliminates manual handoffs, reduces the risk of human error, and frees up valuable engineering time for innovation. This automation is a primary driver for reducing Lead Time for Changes. Furthermore, by integrating automated tests directly into the pipeline, bugs are caught early in the development cycle when they are exponentially cheaper and faster to fix. This "shift-left" approach to quality assurance drastically lowers the Change Failure Rate. Finally, by using features like YAML pipelines-as-code and native container support, organizations can create standardized, consistent, and repeatable deployment processes, which improves the success rate and predictability of every release. In short, Azure Pipelines is the engine that drives Deployment Frequency up and Change Failure Rate down.
Aligning Strategy with Execution using Azure Boards
Speed without direction is waste. A common failure point in large organizations is the disconnect between executive strategy and the day-to-day work of development teams, creating an "IT black box" where leaders lack visibility into progress and resource allocation.
Azure Boards is more than a simple task tracker; it is an enterprise-grade agile planning tool that provides hierarchical visibility from high-level strategic themes all the way down to individual developer tasks. Features like Portfolio Management and Delivery Plans give program managers and executives a consolidated, cross-team view of progress, dependencies, and timelines, ensuring that engineering efforts are always aligned with overarching business objectives. Customizable dashboards provide real-time visibility into project health and key performance indicators, tailored for every stakeholder from team leads to the C-suite. This strategic alignment ensures that the velocity gained from Azure Pipelines is directed at the
right priorities, maximizing the business value of every development cycle and answering the CFO's critical question: "Are we investing our engineering budget in the most impactful initiatives?".
Breaking Down Silos with Seamless Integrations
In many enterprises, the technology toolchain is fragmented. Development may happen in Azure DevOps, while project management resides in Jira and IT service management is handled by ServiceNow. This creates operational silos, leading to friction, redundant manual data entry, and a lack of end-to-end traceability.
Azure DevOps is designed as an open platform with robust integration capabilities. The integration with Jira, for instance, allows product managers to plan and track work in their preferred tool while giving developers a seamless workflow in Azure DevOps. This provides full traceability from a Jira issue through to the associated code, build, and deployment, giving managers real-time visibility without forcing developers to switch context. Similarly, integrating with ServiceNow connects development work directly to IT operations and change management processes. This can automate the creation of change requests from deployments, ensure compliance with ITIL processes, and provide a closed feedback loop from production incidents in ServiceNow back to bug work items in Azure Boards. This integrated strategy reduces operational overhead, improves cross-departmental collaboration, and ensures the end-to-end governance and traceability that is critical for CIOs, especially in regulated industries.
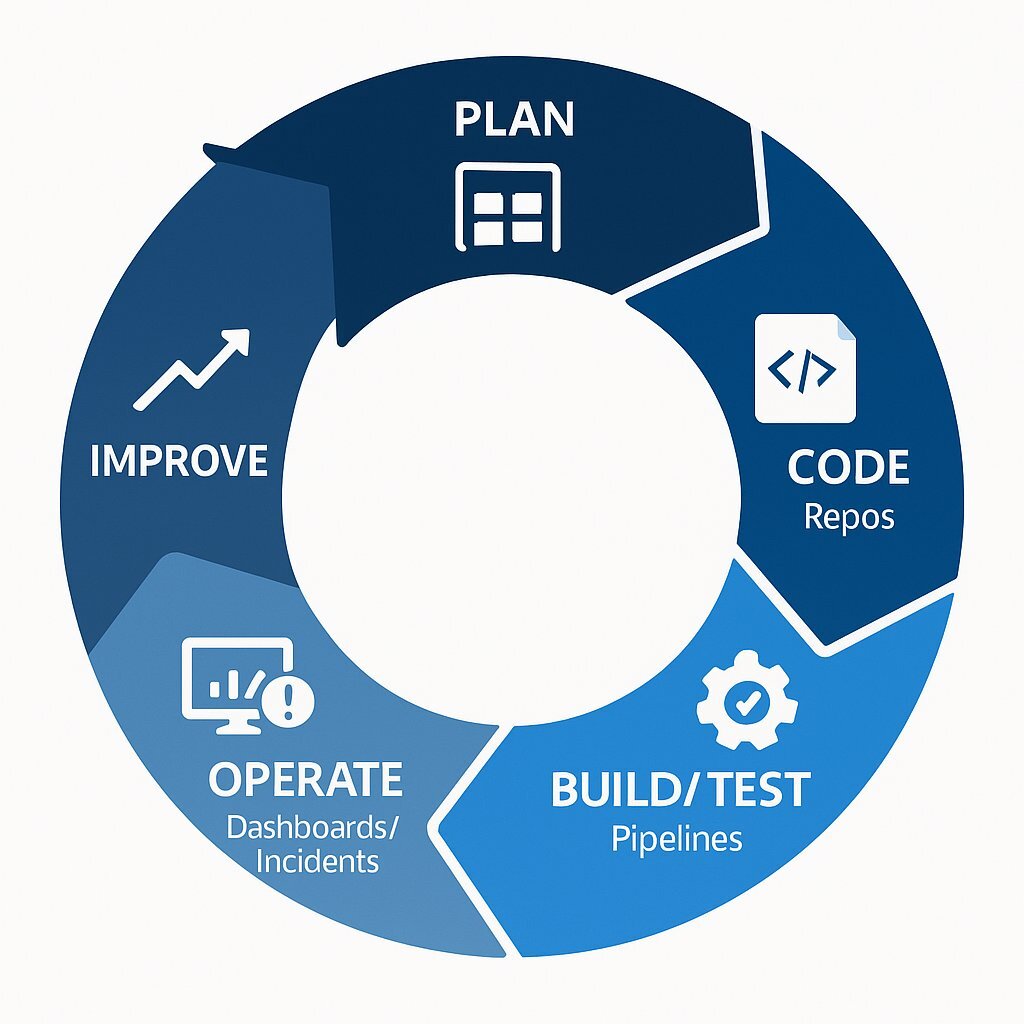
The true power of Azure DevOps emerges not from its individual tools, but from their native integration, which creates a data flywheel for continuous improvement. When a work item is planned in Azure Boards, linked to a code commit in Azure Repos, and then automatically built and deployed by Azure Pipelines, a rich, interconnected data trail is created. If a deployment fails, a new bug can be automatically generated and linked, providing full traceability for analyzing and improving MTTR. All of this data flows into the dashboards, allowing leadership to see not just
what was delivered, but how efficiently and reliably it was delivered. This closed-loop system provides the precise data needed to identify bottlenecks and systematically improve the entire value stream, transforming DevOps from a set of practices into a data-driven, continuous improvement discipline.
Where's the Proof? A Financial Services Firm's 45% Faster Release Cycle
Theory and features are compelling, but tangible results build a business case. A leading U.S.-based financial organization provides a clear example of how leveraging Azure DevOps can transform software delivery and produce dramatic improvements in speed, quality, and compliance. If you're interested in alternative strategies beyond traditional software solutions, explore our comprehensive guide on why custom software is being chosen by enterprise leaders for even greater adaptability and results.
The firm was struggling with challenges common in legacy environments. Releases were slow, high-risk, manual events that consumed significant resources and often resulted in production failures. Bugs were frequently discovered by customers, leading to costly rework and eroding trust. Furthermore, meeting strict SOX and PCI compliance standards was a manual, time-consuming process that acted as a significant drag on innovation.
To address these issues, the organization executed a strategic migration to Azure DevOps. They replaced their manual processes with fully automated CI/CD workflows using Azure Pipelines. They adopted Azure Boards for agile planning to manage backlogs and provide clear visibility into the development process. Critically, they implemented a DevSecOps strategy, integrating security and compliance checks directly into the pipeline to ensure standards were met automatically with every single build. The results, detailed below, demonstrate a profound operational and financial transformation.
Case Study: Core Performance Metrics (Before vs. After Azure DevOps)
| Metric | Before Azure DevOps | After Azure DevOps | Improvement | Business Impact |
|---|---|---|---|---|
| Release Cycle Time | 10 weeks | 5.5 weeks | 45% Reduction | Faster Time-to-Market |
| Pre-Production Defect Detection | ~20% | ~90% | 70% Improvement | Higher Quality, Lower Rework Cost |
| Deployment Frequency | Monthly | On-Demand (Daily) | >20x Increase | Increased Agility & Responsiveness |
| Change Failure Rate | 25% | <5% | 80% Reduction | Improved Stability & Customer Trust |
| Compliance Reporting | 40 hours/month (manual) | 4 hours/month (automated) | 90% Reduction | Streamlined Governance, Lower Audit Cost |
Data compiled from a Veritis case study and supported by similar results from Arriaga Technology Consulting case studies.
These operational improvements translated directly into significant financial and strategic returns for the business. For decision-makers who want to maximize long-term value, check out our modern playbook on software maintenance mastery and post-launch success—a key piece of the overall DevOps ROI puzzle.
Case Study: Financial and Operational ROI
| Business Outcome | Metric | Result | Financial & Strategic Impact |
|---|---|---|---|
| Increased Productivity | Feature Throughput | ~40% Increase | Engineering teams deliver more value with the same headcount, focusing on innovation instead of maintenance. |
| Reduced Operational Costs | Infrastructure & Rework Costs | ~35% Reduction | Lower costs associated with fixing production bugs, manual compliance tasks, and incident management. |
| Mitigated Risk | Production Incidents | ~80% Reduction | Minimized risk of revenue loss and brand damage from service outages. Ensured consistent SOX/PCI compliance. |
| Accelerated Revenue | Time-to-Market for New Features | 45% Faster | Ability to capture market opportunities faster, respond to competitive threats, and generate revenue from new products sooner. |
This transformation is not unique. Microsoft itself leverages Azure DevOps to manage its massive engineering systems, demonstrating the platform's enterprise readiness and providing a model for (https://azure.microsoft.com/en-us/solutions/devops/devops-at-microsoft). If you’re seeking to boost business agility, you may also explore how Agile principles drive ROI for modern organizations.
What's the First Step to Calculating Our Potential ROI?
As the management adage goes, "you can't manage what you can't measure". The journey toward a 45% faster release cycle begins with a clear understanding of your starting point. A preliminary business case can be built by following a simple, practical framework for self-assessment.
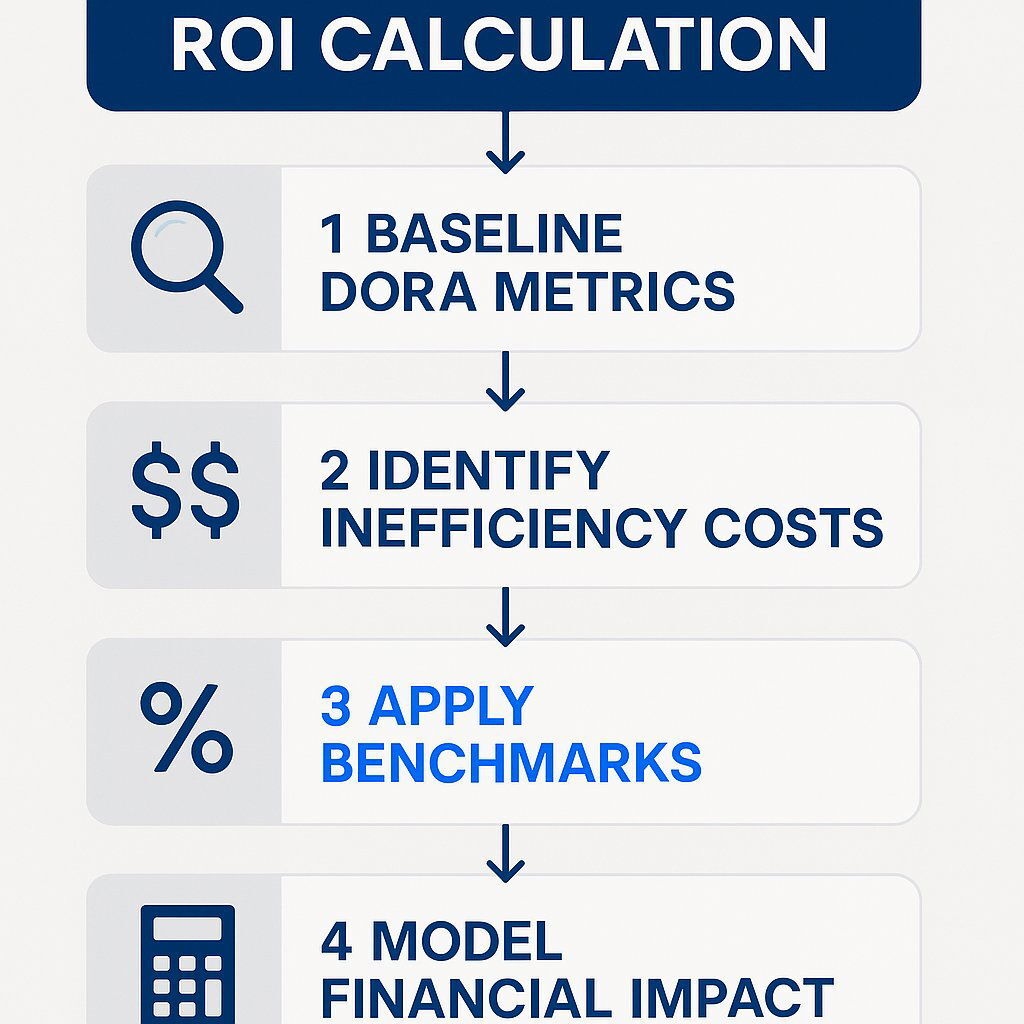
- Establish Your Baseline: The first step is to gather data on your current performance against the four DORA metrics. Even high-level estimates are a valuable starting point. How long does it really take to get a business idea into the hands of a customer? How often do your releases fail and require emergency intervention? For a comprehensive overview of these metrics, Atlassian's guide to (https://www.atlassian.com/devops/frameworks/devops-metrics) is an excellent resource.
- Identify the Costs of Inefficiency: Next, quantify the "hidden factory" costs of your current process. How many developer-hours are consumed by manual deployment activities, emergency hotfixes, and fixing bugs that should have been caught before production? What is the estimated business cost of downtime for your critical applications? For a holistic budgeting strategy, see the 2026 executive playbook for software budgeting—vital for leaders calculating TCO and ROI.
- Model the Potential Gains: Use the improvements from the case study—such as a 45% reduction in cycle time, a 70% improvement in defect detection, and an 80% reduction in production incidents—as benchmarks. Apply these percentages to your own baseline costs and revenue streams to project the potential savings and value creation for your organization.
A preliminary estimate is a powerful tool for initiating a strategic conversation. However, building a comprehensive business case that will secure stakeholder buy-in requires a deeper analysis. Baytech Consulting specializes in partnering with leaders like you to conduct a thorough DevOps assessment, benchmark your performance against industry leaders, and build a tailored ROI model for your unique business context.
Conclusion: Your Path to a 45% Faster Release Cycle Starts Now
The evidence is clear. The ROI of DevOps is not an abstract ideal; it is a measurable impact on business speed, quality, and resilience, best tracked by the four DORA metrics. Azure DevOps provides a comprehensive, integrated platform designed to drive elite performance across these critical indicators. The results are proven, as demonstrated by the financial services firm that cut its release cycle by 45% while dramatically improving quality and compliance.
In today's hyper-competitive market, the ability to deliver value to your customers faster and more reliably than your competition is the ultimate advantage. The question is no longer if you should invest in a modern DevOps platform, but how quickly you can realize the return. For organizations evaluating change, the importance of a robust early project phase can't be overstated; see our in-depth analysis on why the Discovery Phase can save your software project and budget before you begin your transformation.
About Baytech
At Baytech Consulting, we specialize in guiding businesses through this process, helping you build scalable, efficient, and high-performing software that evolves with your needs. Our MVP first approach helps our clients minimize upfront costs and maximize ROI. Ready to take the next step in your software development journey? Contact us today to learn how we can help you achieve your goals with a phased development approach.
About the Author

Bryan Reynolds is an accomplished technology executive with more than 25 years of experience leading innovation in the software industry. As the CEO and founder of Baytech Consulting, he has built a reputation for delivering custom software solutions that help businesses streamline operations, enhance customer experiences, and drive growth.
Bryan’s expertise spans custom software development, cloud infrastructure, artificial intelligence, and strategic business consulting, making him a trusted advisor and thought leader across a wide range of industries.